


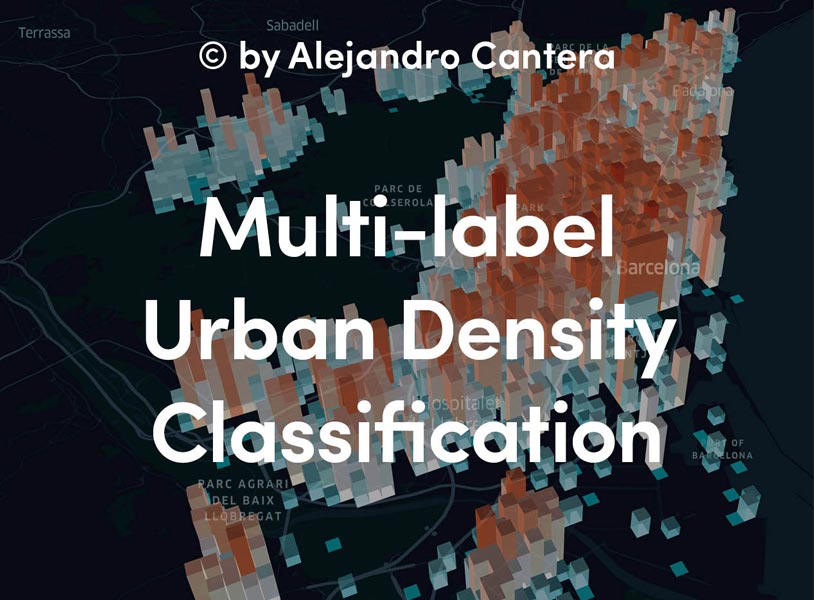
The study of urban density helps us to understand better the complex organism of a city, analyzing not only quantity aspects, but also the quantities of life and activity, sheltered in a determined urban grid. In this way, the urban density reports about the critical amount of people needed for the efficient and fluid development of urban functions, while at the same time affecting the mixture of land uses, the variety of typologies and the vitality of public space. The goal of the project is the creation of a predictive model of urban density classification, based on the analysis of orthophotos of any city in the world.

Urban density is defined as the number of residences per unit of area existing in a certain urban zone. It helps us to understand better the complex organism of a city. Low density is marked by expansive growth and high resource consumption, which increases pressure on the territory, while high density in urban areas can cause the congestion of public spaces and services. The aim of cities is optimum urban density, which allows for diversity both inside the city and on its fringes, achieving the correct sizing of services, public space and networks. This improvement of urban compactness allows for the creation of stable and resilient urban development, which can incorporate proposals of sustainable growth through an understanding of the territory’s physical reality. For this reason, it is very useful to create a model that provides quick knowledge of the flows of movement inside cities.
The project defines a model of supervised learning built by Deep Learning techniques and trained with labelled orthophotos containing urban density data for the whole city of Madrid, obtained from the land registry and the PNOA (Plan Nacional de Ortofotografía Aérea) from the IGN (Instituto Geográfico Nacional). To perform the multi-label classification, the model was built using a convolutional neural network (CNN), the kind of Deep Neural Network typically used as an image recogniser. A CNN consists of an input and an output layer and multiple hidden layers (knowledge as Neuron), that works by learning filters and patterns within a restricted region of the visual field that will overlap to cover the entirety of the visual field. The hidden layers of a CNN typically consist of convolutional layers, pooling layers, fully connected layers and normalization layers. The project develops three kinds of CNN architecture – one basic CNN and two deep CNN models with VGG-16 and VGG-19 – and then chooses the one with highest score.

Due to the fact that it is a supervised learning model, in order for the model to learn, it must be taught previously using orthophotos that have been labelled with the accurate urban density. To that end, a total of 7,500 images are labelled. This number of images corresponds to the whole city of Madrid (using a convolutional grid in order to avoid problems with the limits). Residential density is calculated by dividing the quantity of existing homes and the area unit (ha). This calculation is done in a squared grid with cells of 250 by 250 meters, and the urban density scale used is the typical one used in urban planning: Null Density: 0 homes/ha; Low Density: 10, 20, 40, 60 residences/ha; Medium Density: 80, 100, 120, 160 residences/ha; High Density: 200, 240, 320, 400 residences/ha. The project creates different predicted models depending on the labelled ranges of urban density (4, 7, 12 feature labels).

After the training process (in which the model learns based on all the input orthophotos), containing more than 50 epochs (one epoch is one pass of the full training set), it is necessary to evaluate each model to find out how it works. During this process the confusion matrix is the best way to understand how the model works because it determines the number of True Positives, False Positives, True Negatives and False Negatives. Thus, it is possible to define the Recall, the Precision, the F2score, and the Accuracy for each label. Each of these metrics is defined as follows:
· PRECISION = TP / (TP+FP)
· RECALL = TP / (TP+FN)
· F2SCORE = 5 · ((PRECISION·RECALL)/(4·PRECISION)+RECALL))
· ACCURACY = (TP + TN) / (TN+TP+FP+FN)
Once the evaluation process for each model is finalized, the results are compared in order to choose the best predictive model for each labelled range. The results and conclusions are as follows:
- a) Model with 4 feature labels
| Model | Test F2Score | Test ACC Score |
| CNN_4cat | 0.5211 | 0.7887 |
| VGG16_4cat | 0.8137 | 0.9067 |
| VGG19_4cat | 0.8643 | 0.93 |
- b) Model with 7 feature labels
| Model | Test F2Score | Test ACC Score |
| CNN_7cat | 0.4042 | 0.8653 |
| VGG16_7cat | 0.7390 | 0.9235 |
| VGG19_7cat | 0.8083 | 0.9433 |
- c) Model with 12 feature labels
| Model | Test F2Score | Test ACC Score |
| CNN_12cat | 0.3335 | 0.9234 |
| VGG16_12cat | 0.7447 | 0.9545 |
| VGG19_12cat | 0.7162 | 0.9466 |

This evaluation process helps to select the best predictive architecture to classify the orthophotos of other cities with different urban density ranges. In order to evaluate this urban diversity, two different cities are analysed. In both cases, the evaluated zone encompasses an area of 80 x 80 tiles, equivalent to an area of 400 km2:
· Barcelona : a city with similar urban characteristics, whose images are from the same data source (PNOA).
· Bogotá: a city with a different urban configuration, and whose data source it is also different. The origin of these images comes from the WMS services of the Bogotá land registry.


The principal aim is to test the predictability capacity of the models in different situations, not only because the images could have been taken at a different moment in time and with different light, but also because the urban morphology of the cities may be different from the trained city. For this reason, the project does not aim to create a unique classification tool for all cities. In that sense, in the future it could be implemented with different examples and other data fonts (not only urban density). The goal of this project is the creation of an initial prototype that will introduce Deep Learning techniques into city analysis and that will let us develop new focuses for territorial action.