


When we describe a city, we usually talk about its boundaries, the elements that compose it, the organization of its uses, the depletion of its land and the flows that take place within it. This description of anatomical nature becomes more complex and precise the more detail it can incorporate. It is an explanation that is impossible to complete, faithful to the constant changes that occur in the object being described. Therefore, in the attempt to achieve a perfect description, we are at risk of generating an exact reproduction of the city we are trying to explain – just as complex and incomprehensible.
As a result, when explaining a city like Madrid through cartography, we must accept the need to omit some of the elements that compose it, in the same way that the reduction of dimensions in a dihedral drawing allows us to delve better into the analytical description of space than the visual richness of perspective.
Unscrambling Madrid is a cartographic experiment that illustrates the city, representing only the spatial relationships between the different urban elements, trying to explain and characterize them according to their heterogeneity. What the drawing omits is perhaps its real protagonist, and the image that remains has the harsh duty of referring to the absences.
The maps mask what gives shape to the city – what we can commonly see in its epidermis as we walk through its streets and enter its buildings – to highlight how all these elements are interrelated. As if the links between things (defined by the space that separates them) were what characterizes the urban phenomenon: responsible for its interactions, mixtures and complexity. Ultimately, the maps explain the city through the ways in which urban things intermingle.
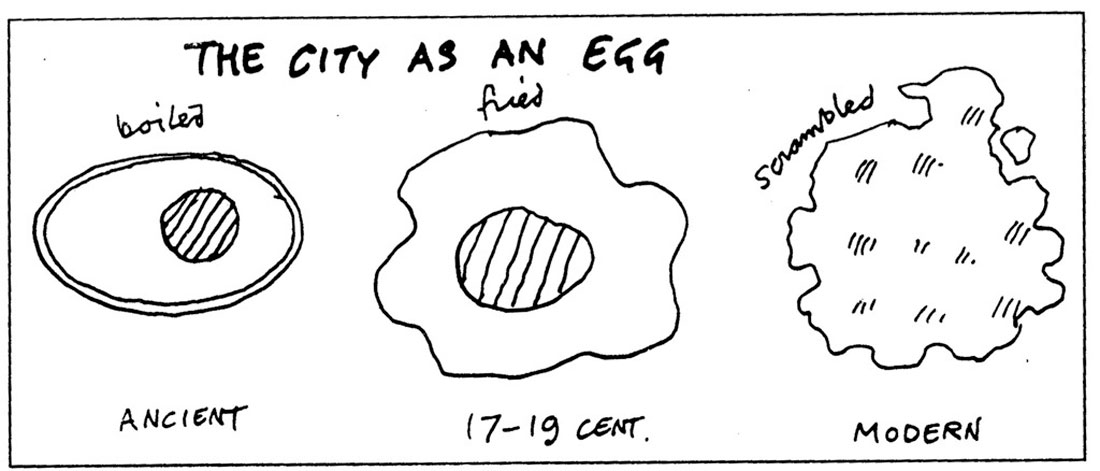
In addition, this cartographic narrative attempts to characterize this mixture, understanding that the ingredients that shape the city must be combined in a certain way, as Frederic Price exposes in his analogy between the city and the different methods for cooking an egg. Price proposes an evolutionary description that goes from the almost perfect hard-boiled egg, embodied by ancient cities (the result of walled settlements), to scrambled eggs, comparable to modern cities (expanded in a formless way over the vast territory). This metaphor exemplifies how often the city’s components are similar (such as the yolk and the white) and, still, their combination is crucial in the final recipe.
Most Spanish cities are built from the same elements (in similar proportions): residential areas, productive land, young populations, and elderly inhabitants. However, what makes each city unique is the arrangement of the different components in space, the mixture and juxtaposition of elements of various sizes and natures.
Considering all these reasons, the cartographic description proposed in the exhibition sets aside the layout of the streets and their buildings, focusing on other urban dimensions arising from the growing datafication of the world.
This new working material allows us to analyze both morphological and demographic phenomena, together with other aspects reflecting the ephemeral flows that occur in the city. The different datasets (from structured and unstructured information sources) act as color palettes, allowing us to build an image of the city that, although invisible to the naked eye, faithfully explains its nature.
The Structure of the Narrative
The five maps are composed of 20 layers (grouped into four chapters), which follow a disciplinary order that paraphrases the classification proposed by Ildefons Cerdà in his General Theory of Urbanization. To this end, the description begins with the container (the built city), then the content (the inhabited city) and, finally, its functions (the city of uses and the shared city). This explanation refers to other concepts such as form and behavior, flesh and stone, or ville and cité – all addressed by the urban thinker Richard Sennett in his work.
The final synthetic image refers to some of the concepts exposed in the previous maps. Specifically, it shows the transformation using distinct values throughout different time ranges: days, weeks, years or decades. This variation covers the daily migrations (from home to work), the change from daylight activities to night leisure, the transition of the different population groups (with their ages and incomes), and the transformation of the urban land and buildings, which ultimately give shape to the city.
An Algorithmic View
This description of Madrid is novel because it constructs an algorithmic approach to the city based on data (mostly from public and open sources) resulting from a unique context inside Europe.
On the one hand, in the first two chapters, the basic components of the urban fabric are illustrated through information derived from planning documentation, administrative records and other sources of statistical information. On top of this base, the behavioral layers provide complexity from unstructured data describing dynamic aspects.
For example, we have employed datasets from the land registry (Ministry of Finance), on road structure (Open Street Maps), topography (National Geographic Institute), population by income, gender and nationalities (National Institute of Statistics) and on other variables such as trees (Normalized Difference Vegetation Index) and economic activities (open data portals of the city council or the community of Madrid).
Measuring Diversity
In the context of the exhibition, the word “diversity” expresses the capacity to blend all these urban components. It is a sufficiently flexible concept, developed in various facets according to each of the layers and the datasets: for example, we have used the Gini coefficient (from economics), the Shannon index (from biology), standard deviations, variances or simply the unpaired ratio between two values. These statistical tools of a certain complexity summarize the available data into synthetic indicators that are easy to handle.
We applied different strategies to analyze diversity in homogeneous environments within an area (defined by a square matrix of 200 meters). This spatial region refers to the immediate area a person can walk around in less than a minute. This dimension can be recognized at a glance and allows us to build a mental image of what we observe. We analyzed the contents of each area to extract the distinct types of diversity that correspond to the discussed concepts.
Geometry
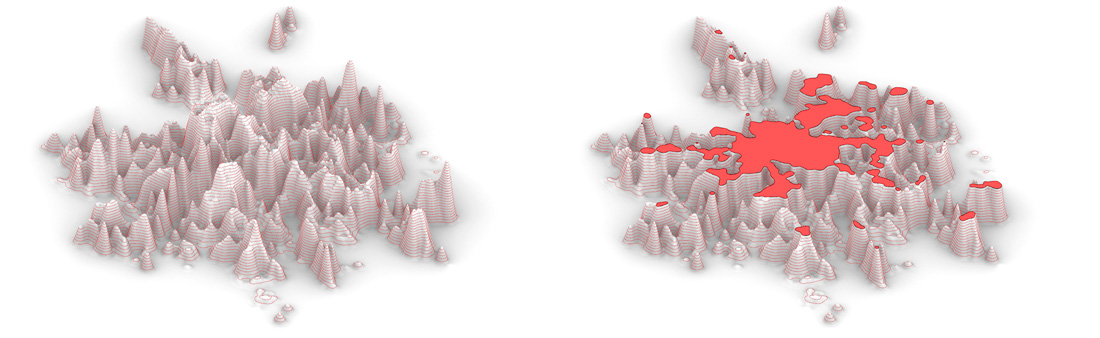
The geometries shown in the maps result from a gravity model (similar to a topographic model) based on the different indicators that measure diversity. As illustrated in the figure, we have made a section at the intermediate level of the model. This method of representation method emphasizes the areas within the city that present higher values of diversity (either of people, building ages, or rents) and, by contrast, those places where diversity is lowest or non-existent.
Each of the layers has been overlapped with others in the same group of contents, according to the five main concepts from the exhibition narrative. This overlay of color lets to observe simultaneously how the different values of diversity are superimposed in space. The places that concentrate a different mixture of colors represent the areas of greater complexity, while a single color indicates the presence of a single layer.
Conclusions
The Madrid Diversa exhibition aims to be a record of complexity, a description of what is different and diverse. It should serve as a model and benchmark for what the city should always be, while helping us learn from mistakes and dysfunctions for future transformations.
Today, many cities are moving towards a necessary paradigm shift (driven by critical climate change scenarios) based on decarbonization and a drastic reduction in mobility. Despite the myriad of benefits, this reduction of movements negatively impacts the possibility of different social sectors meeting in various parts of the city, reducing social complexity by decreasing interaction between groups of citizens.
The reduction of mobility pushes us towards more homogeneous urban environments that risk becoming less and less spatially complex, more segregated or ghettoized – moving from diversity to a clustering and autonomous functioning of the city’s small parts.
This exhibition does not question these novel urban models (towards which we will necessarily have to evolve). It describes the city of Madrid today, as the product of a specific way of understanding and building urbanity – a paradigm we are just now observing in its fullest expression, on the eve of the coming transformation.
As Richard Sennett reminds us, a city is the milieu where we are most likely to meet strangers. This quality derives from diversity. It is the key to the urban phenomenon. No doubt, diversity in Madrid is the characteristic that best explains its degree of urbanity and its capacity to generate chance and random encounters.
Check out Madrid Diversa‘s maps to learn more.