


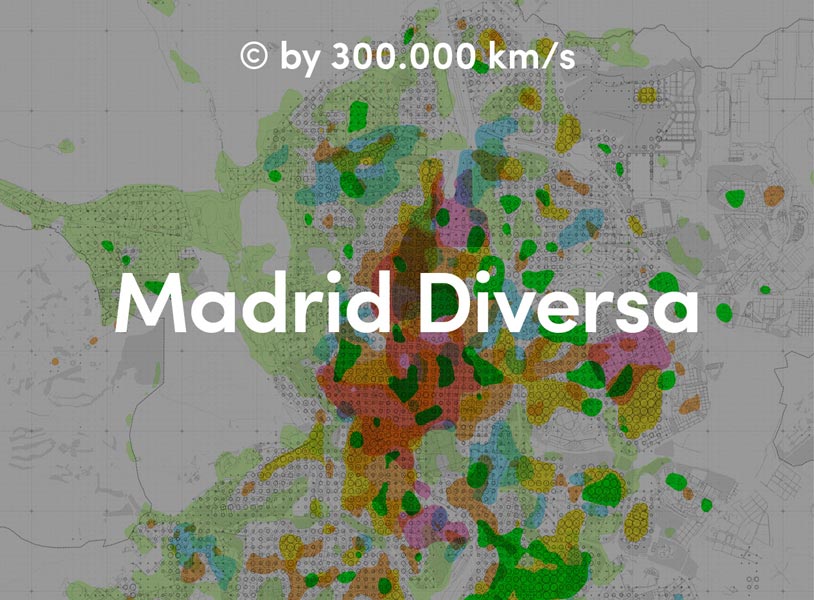
1. The Built City
Madrid is a dense city with a complex urban fabric, from the center to the peripheral areas with their varying intensities. This map describes the different granularities of the urban fabric based on the variability of the size of the plots, the combination of small and large dwellings, and the combination of different building qualities resulting from the coexistence of historic buildings and new constructions in a single neighborhood.
Data sources used: Land Registry
Represented diversity parameters:
– Dwelling size
– Plot size
– Built quality
– Year of construction of the buildings
– Built density

Diversity of dwelling size (Standard dwelling size deviation) – Data obtained from the Land Registry
Although approximately 50% of the built surface area of our cities is given over to residential use (which means we can find houses practically everywhere), the final form that these dwellings take synthesizes many of the characteristics of the urban environment. Their most symptomatic value may well be their size, but this parameter alone is only able to identify large or small dwellings. If we look at them as a whole in a specific area, however, we can see certain patterns: homogeneous groupings of small dwellings in some of the city’s suburbs; high and equally homogeneous values when they correspond to new high-income fabrics or diverse values where new buildings are inserted among old buildings (where different types of population coexist in the same place to accommodate their different needs).
The difference in dwellings’ sizes also reflects the diversity of their inhabitants: their incomes, the number of people in the household, etc.
Plot size diversity (Standard plot size deviation) – Data obtained from the Land Registry
The division of the city into plots (or how the different land holdings are divided up) corresponds to historical layouts, the former boundaries of agricultural plots, or lines drawn on large pieces of land that were subdivided for housing development. The more or less chaotic mosaic of plots of land stitched together by the city’s streets can explain how the growth processes have taken place, the logics of urban advancement, and even where housing development has been carried out solely to maximize profits. The diversity of these permanencies, when small plots are mixed with large plots, reveals the age of the urban fabric (over and above the age of the buildings) and how intense and homogeneous these planning processes have been.
Diversity of the built quality of the buildings (Standard dwelling quality deviation) – Data obtained from the Land Registry
Although the quality of a dwelling reflects the economic capacity of its inhabitants, it is often not homogeneous with its surroundings. Quality diversity reveals neighborhoods in need of regeneration whose barely habitable buildings are infiltrated by others that boast the highest standards.
Housing quality variety is a reflection of the economic diversity of the inhabitants but also of the complexity and heterogeneity of the urban landscape.
Diversity of the age of the buildings (Standard deviation of the year of construction of buildings) – Data obtained from the Land Registry
The year of construction of the buildings (available up to approximately 1900) illustrates how old the environment is. If we also measure buildings’ diversity, we can appreciate renovation processes that exist in the urban fabrics. In newly formed fabrics, we are less likely to find much variance in the age of the buildings. However, in central areas of the city where the urban fabric is older, this diversity can tell us about urban renovation (how many times the building stock has been upgraded).
The diversity of buildings’ ages can indicate both the age of the urban fabric and its level of rehabilitation.
Density diversity (Standard deviation of built density) – Data obtained from the Land Registry
Density is undoubtedly one of the key parameters of urban planning and quite probably one of the most conflictive, given that it regulates the profitability of urban development projects. Its diversity shows the coexistence of low-rise and high-rise buildings. We can find this diversity in urban environments where planning has not been fully implemented or in fabrics that have been subject to all manner of different regulations, whose impact has disfigured their density.
Heterogeneous density is the result of the overlapping of different planning regulations over time, illustrating both the passage of time and the overlapping interests of the landowners.
2. The Inhabited City
The city is inhabited by diverse people. Madrid is a multicultural pole and that’s what makes it so different from other Spanish cities. This demographic diversity also translates into a heterogeneous distribution of income – from vulnerable neighborhoods to very well-to-do environments – and types of income, including people who earn salaries, the unemployed, people of independent means, or entrepreneurs.
Data sources used: INE (National Statistics Institute)
Represented diversity parameters:
– Population by gender
– Population by age
– Population by nationality
– Population by income
– Population by sources of income

Population gender diversity (proportionality of male and female population – 0 proportionate, 1 disproportionate) – Data obtained from the National Statistics Institute
The homogeneous distribution of men and women in the city is an exceptional feature. This ratio tends to tip one way or the other for several reasons. For example, because of the fact that women live longer, there are more women in older population groups. In the case of men, most young migrants tend to be male, hence there are more of them in the fabrics that host migrants. The homogeneity of both sexes is, in many cases, a complex coincidence of multiple factors such as age, income or nationality.
Population age diversity – Data obtained from the National Statistics Institute
Low-income neighborhoods tend to have younger populations, while areas with more affluent populations (even those located in the suburbs) have older populations.
Age diversity also implies a multiplicity of knowledge and learning. A diverse population is one that includes both those who need care and those who can provide care. A caring city does not expel older people from hostile urban environments and creates friendly environments for younger people.
Diversity of population nationalities – Data obtained from the National Statistics Institute
Madrid is a city that attracts migration flows from all over the world. These citizens are characteristic of a global metropolis. Different cultures, traditions and knowledge can either remain isolated in closed groups or intermingle and hybridize with each other. The diversity of nationalities is an indicator of globalization and the evidence of a cultural complexity on which the city feeds.
Diversity of population income – Data obtained from the National Statistics Institute
The complexity of the different urban factors often results in the existence of a considerable diversity of incomes. The variety of dwellings, as well as their quality, generates fabrics in which occupants with different incomes can find an optimal place in which to make their home. Greater income diversity means higher interaction between those demographic sectors that would otherwise tend to be segregated by the horizontal expansion of the metropolis.
Income diversity – Data obtained from the National Statistics Institute
Income diversity is both a reflection of the diversity of the different qualities of dwellings and other factors such as the existence of old rent-control leases or other situations. It is therefore interesting to see where income diversity does not correspond to income diversity, as this lack of coincidence reflects other levels of complexity.
3. The Shared City
Streets, squares and parks are meeting places and the setting for the construction of social relations. The diversity of public space is determined by the quality and the heterogeneous nature of green infrastructures, obtained from satellite images, and by the different number of plant species, but also by the analysis of the urban landscape created by the buildings – with different heights and sections with respect to the streets.
In Madrid, this public space is extremely busy, something that can be measured by the intensity of the movements generated by its shopping areas, quantified by the capacities measured by a number of internet services and the movements of citizens coming from different origins.
Data sources used:
Surveying, satellite images, Madrid City Council
Represented diversity parameters:
– Diversity of plant species
– Diversity of vegetation quality (through the NDVI index)
– Diversity of capacity in venues
– Movements within the neighborhood through the mobile telephony matrix (shared by the INE)
– Diversity of heights (calculated from heights on surveying maps)

Diversity of greenery – Data obtained from Madrid City Council
The diversity of the city’s tree species is a reflection of the complexity of public space. The different species that coexist in the city are a guarantee of greater biodiversity.
Diversity of public space – Data obtained from Madrid City Council
The amount of public space (measured by the available surface area of pavements) is an indicator of the potential to accommodate diverse activities in a space. It is also an indicator of accessibility and walkability given that it measures, in negative terms, the relationship between space given over to cars and to pedestrians.
Diversity of vegetation quantity – Data obtained from Madrid City Council
While vegetation is desirable in the city, what is even more desirable is its uneven distribution: it should be mixed with more mineral uses, not segregated but infiltrated. Greater diversity in the amount of vegetation results in more complex public spaces. It also reveals the relationship we establish with the natural environment.
Diversity of pedestrian flow – Data obtained from the Internet
Pedestrian flow in streets fluctuates according to the time of day, depending on the services available on the city’s ground floors. This rhythm can be monotonous due to there being either too much activity or not enough. Activity diversity will therefore be found in streets that fill up and empty out, in places where quiet and bustle occur sequentially throughout the day.
Visitor diversity – Data obtained from the Internet
Citizens walking the streets may come from the neighborhood itself or from elsewhere. This diversity of origins of people in an environment clearly indicates the social complexity that the uses of a given place are capable of attracting.
Diversity of urban volume – Data obtained from the IGN (National Geographic Institute)
The urban landscape is strongly defined by the volume of the buildings that delimit it. The irregularity of this outline is reflected in the diversity of these volumes and creates a lively landscape.
4. The City of Uses
The city is articulated by how the land is used – uses that are organized and mixed during the urban planning stage to give rise to diverse environments such as residential neighborhoods, office districts, cultural and administrative uses, and mixed-use zones. Above and beyond these cadastral uses, and generally as a complement to housing, a multiplicity of economic activities are defined that can come and go or remain in place over time. Uses and activities define the urban landscape and create a city of proximity, whenever the population is adequately supplied in the vicinity of their place of residence.
Data sources used: Land Register, Activity Licenses (Madrid City Council)
Represented diversity parameters:
– Diversity of cadastral uses (housing, retail, offices, among others)
– Proportion of housing in relation to other uses
– Diversity of economic activities on street level
– Diversity of years street level activities have been carried out
– Proximity to essential services (food, education, banking services and pharmacies)

Diversity of urban uses – Data obtained from the Land Registry
Madrid’s urban fabric tends to be mixed: housing is intermingled with retail premises, offices and other uses. The proportion of each of these ingredients defines the city as a large container able to accommodate the uses that the citizens need. The ratio of diversity comes from the number and surface of the different uses; therefore, it is a reflection of how mixed the city is.
Diversity of residence ratio – Data obtained from the Land Registry
If we specifically measure residential uses, we will come up with a description of the city that is balanced between near single-function residential fabrics and fabrics that can accommodate other activities (that can in turn provide and complement what a residence alone cannot).
Diversity of type of economic activities on street level – Data obtained from Madrid City Council
The commercial fabric can cater to the needs of the inhabitants living in the vicinity, or it can target a metropolitan public willing to travel on occasion to go shopping. In a context of a crisis in High Street retailing due to e-commerce, commercial diversity (an indicator that measures the number of different activities) is a good way to characterize this vitality.
Diversity in the history of economic activities on street level – Data obtained from Madrid City Council
Commercial vitality is also measured by how long the shops have been in business. The areas in which old establishments exist alongside newly opened ones are a reflection of a fabric that is being renewed, one that reconciles what we need from the past with the new needs of the present.
Diversity of residence services – Data obtained from Madrid City Council
Everyday life requires proximity to a variety of services, such as food supplies, education, pharmacies and access to money (banks and ATMs). Access to this diverse and necessary array of services is key to the proper functioning of residential fabrics.
5. The City in Transformation
The city is a changing organism. Its inhabitants are transformed either throughout life cycles (new inhabitants) or as a consequence of economic circumstances (changes in income). Buildings are renovated and new ones created over the decades, shaping new urban landscapes. But the city also changes in very short periods of time, such as in the course of a day. Citizens commuting home from work shape daily movements between different neighborhoods, and the dynamics of activities change as day turns into night.
Beyond the diversity that exists, this map provides a description based on the variation of the values that characterize it. Although some of the variables discussed above are indeed covered here, they are viewed from the perspective of the passage of time.
Data sources used: Land Registry, Activity Licenses (Madrid City Council), demographic and income data published by the National Statistics Institute (INE).
Represented diversity parameters:
– Ratio of young population (INE)
– Movements out of the neighborhood through the mobile telephony matrix (shared by the INE)
– Buildings erected in recent years according to Land Registry data
– Variation in income between 2015 and 2017
– Variation of activities between day and night
 Variation in the age of the population – Data obtained from the National Statistics Institute
The ratio of young people to older people is an indicator of the rate of ageing. This value will anticipate the demographic changes in a specific area – whether the population is ageing or getting younger – thus altering some of the key values that characterize diversity at the present time.
Journey variation – Data obtained from the National Statistics Institute
The number of journeys that the population makes each day outside their own urban environment is a value that clearly describes the likelihood that these citizens will be able to meet other inhabitants of the same city. This is a characterization of diversity through possible interactions with citizens from other places.
Variation of the building stock – Data obtained from the Land Registry
Urban layouts are consolidated by buildings and are gradually renewed either by urban regeneration or by the erection of new developments. This renovation characterizes how each urban fabric transitions.
Variation in income – Data obtained from the National Statistics Institute
The variation in incomes recorded over different years shows us how prosperity does not occur proportionally throughout the territory. This indicator shows the transformation from a socio-economic point of view.
Variation between day and night – Data obtained from the Internet
The variation of pedestrian flow between day and night shows how the transformation of the urban environment occurs over the course of the day, thus accounting for the dynamic phenomena that unfold in the city over 24 hours – altering both its functional dynamics and the urban landscape.
Read Unscrambling Madrid to learn more about the project.