


Developments in CO2 emissions are, among other things, determined by underlying developments in transport, such as transport demand, volumes, distances and modal shares. As such, it is important to note that freight transport modal shares differ between the project cities.
On-road freight vehicles are designed to transport goods on public roads or highways.
![]()
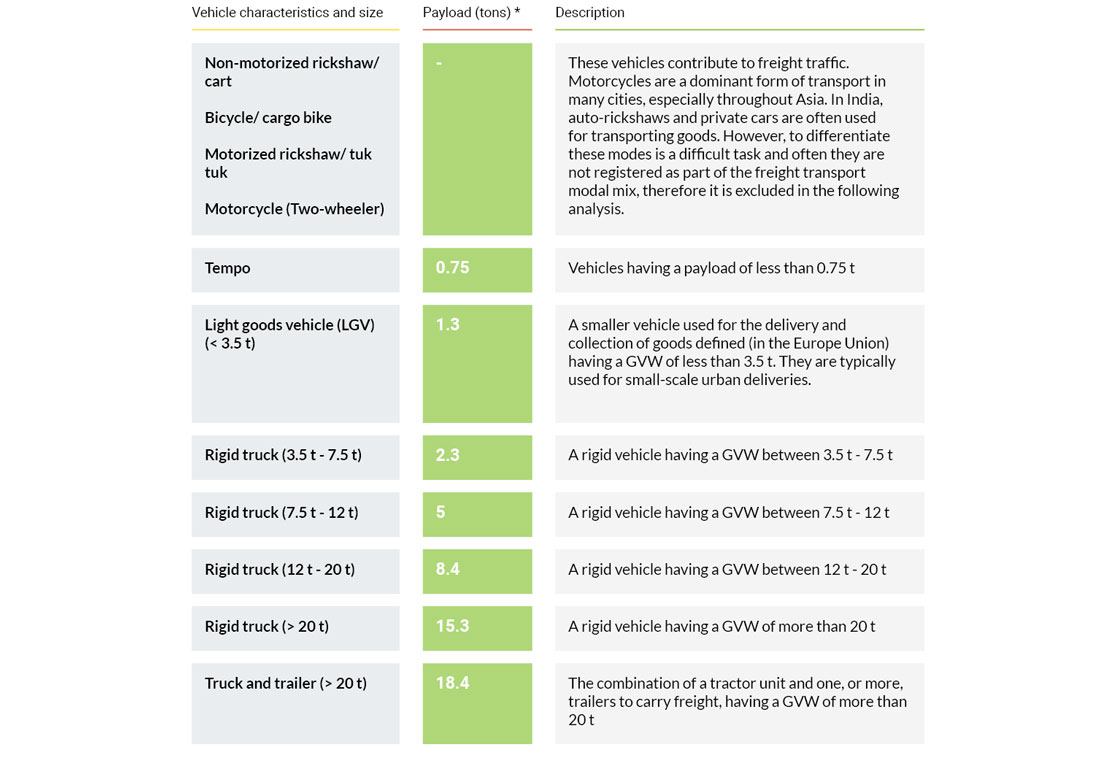
Vehicle classification schemes vary from country to country, based on vehicle size, gross vehicle weight, horsepower, number of axles and a wide range of other local factors. For the purpose of this report, road freight vehicles are broadly classified into the following categories:
 The Share of Freight Vehicles in the Registered Vehicle Fleet
As illustrated in Table 1 registered freight vehicles include pick-ups, vans, trucks, tractors and (semi-) trailers. Notably, the ratio of freight vehicles to total registered vehicles differs in three countries, as the registration methods vary from one to the other. In Colombia, the ratio ranges from 2 to 7 percent, while in Argentina, the ratio is up to 12 percent. In India, freight vehicle represent up to 39 percent of the total registered vehicles in the city.
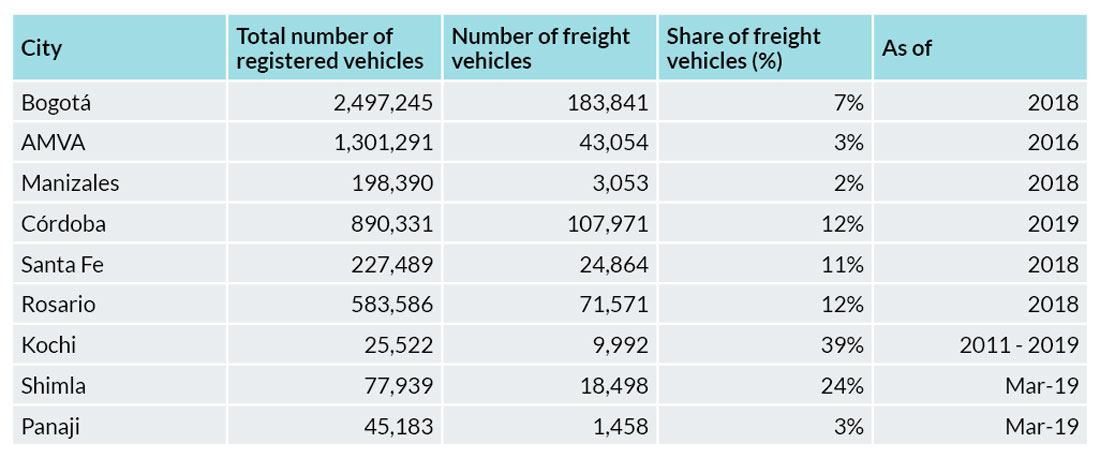
Table 1: Number of registered freight vehicles in the cities. (Source: AMVA: Área Metropolitana del Valle de Aburrá, 2018; Manizales: Manizales Cómo Vamos, 2020; Córdoba: values are sourced from the Córdoba Metropolitan Area, a unión of medium localities of the Colón Department, Municipalidad de Córdoba; Bogotá, Santa Fe, Rosario, Kochi, Shimla and Panaji: Information provided by each respective city.)
It should also be noted that while a vehicle may be registered in one city, it does not necessarily mean that the vehicle is kept and used in that city. Similarly, vehicles registered at addresses outside of the city may be kept and used in the city. Therefore, the analysis of vehicles registered in the cities does not capture the reality of urban freight transport in the cities. A complementary perspective on how freight is organized is presented in the following sections.
The Share of Freight Vehicles by Vehicle Type in Argentina and Colombia
The size and distribution of a city’s vehicle fleet is often influenced by a wide range of factors, including: geography population density, level of urbanization, major economic activities and the share of light/heavy industry distance among centers of production, processing and consumption as well as regulations and restrictions on freight vehicles in the urban areas, etc. The following section presents the share of road freight vehicles by vehicle type in Argentina and Colombia. In India, it is difficult to segregate the number of registered freight vehicles by vehicle characteristics, therefore such information is not included here.
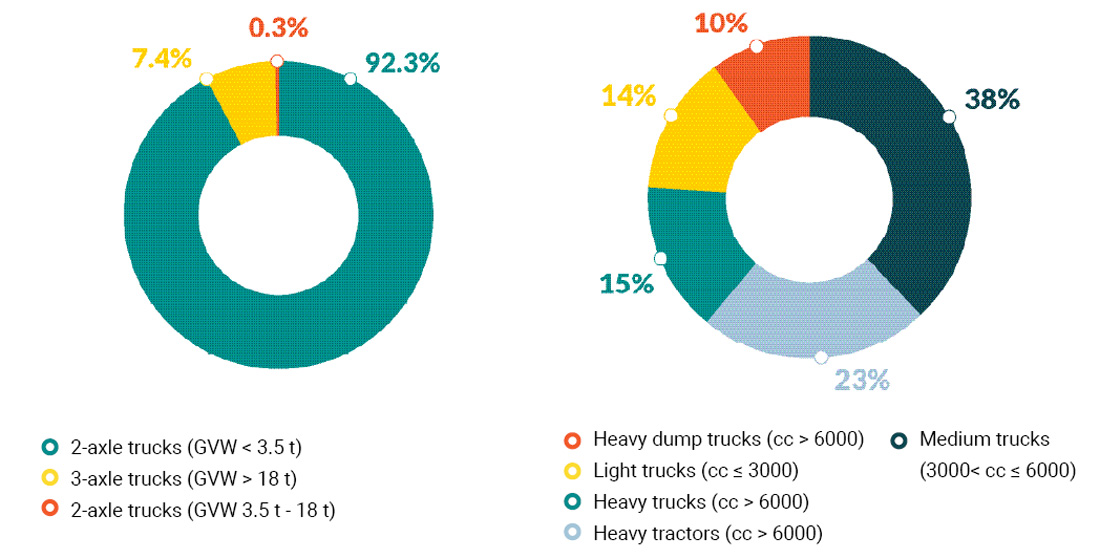
Figure 1: Share of freight vehicles per vehicle type in Bogotá. (Source: The Secretariat of Mobility in Bogotá, 2019)
Figure 2: Share of freight vehicles per vehicle type in AMVA. (Source: Área Metropolitana del Valle de Aburrá, 2018)
As shown in Figure 1, more than 90 percent of the registered freight vehicle fleet in Bogotá consist of trucks with two axles and with a GVW less than 3.5 t, followed by approximately 7 percent of two-axle trucks with a GVW between 3.5 t and 7.5 t.
AMVA’s vehicle categorization is based on its engine displacement – commonly used as an expression of an engine’s size and expressed using the metric units of cubic centimetres (cc, equivalent to millilitres). As show in Figure 2, medium trucks with an engine displacement between 3000 cc to 6000 cc make up 38 percent of the vehicle fleet, followed by dump trucks with 23 percent. Light trucks (< 3000 cc) and heavier trucks (> 6000 cc) account for 14 percent and 15 percent of the freight vehicle fleet, respectively.
Figure 3 shows that pick-ups, vans and trucks make up a large share of the registered freight vehicles in Argentina, even though the figure does not specify the share of vehicles active in urban areas.
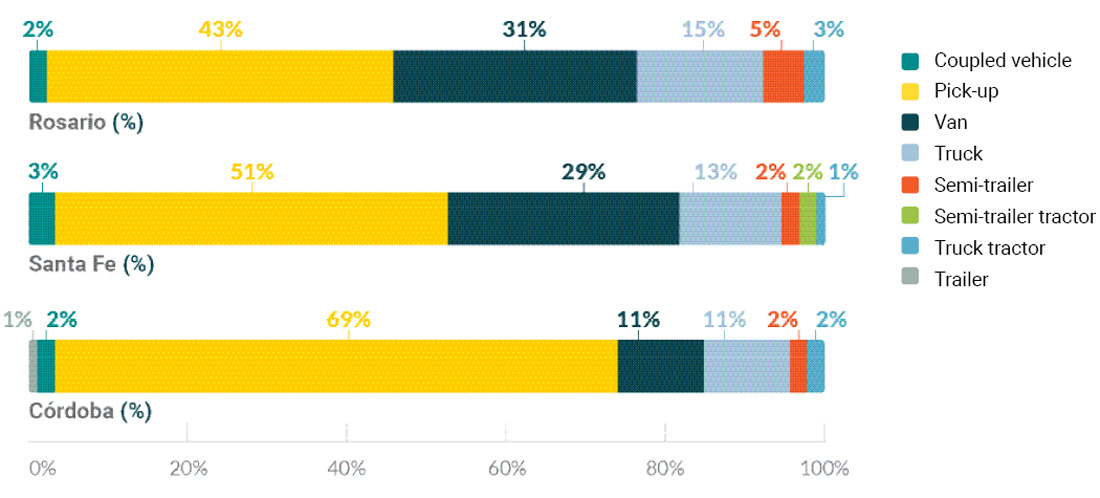
Figure 3: Share of freight vehicles by vehicle type in Argentina. (Source: Córdoba: Municipalidad de Córdoba; Santa Fé and Rosario: Information provided by each respective city. The figures were estimated to enable comparison.)
The Share of Freight Vehicles by Vehicle Age in Argentina and Colombia
The average age of the vehicle fleet is an indirect indication of the environmental performance of road freight transport. The adoption of scrappage schemes financial incentives, mandatory vehicle inspection and maintenance schemes could help decrease the average age of vehicles. The following section provides information about the age of vehicle fleet in the project cities in Colombia and Argentina. Due to paucity of data, such information about vehicles in Indian cities is not included in this section.
The average age of freight vehicle fleet in the project cities is 15 years. Bogotá’s fleet has an average age of 16.4 years, Santa Fe’s fleet has an average age of 15.9 years, and Córdoba also has older than average freight vehicles – approximately 15.2 years. It should be noted that the average age of these vehicles is modeled and must be treated as estimates, and ideally be weighted to the usage of the vehicle[1]. However, several reliable local data sources on fleet characterisation have been used as input to the model.
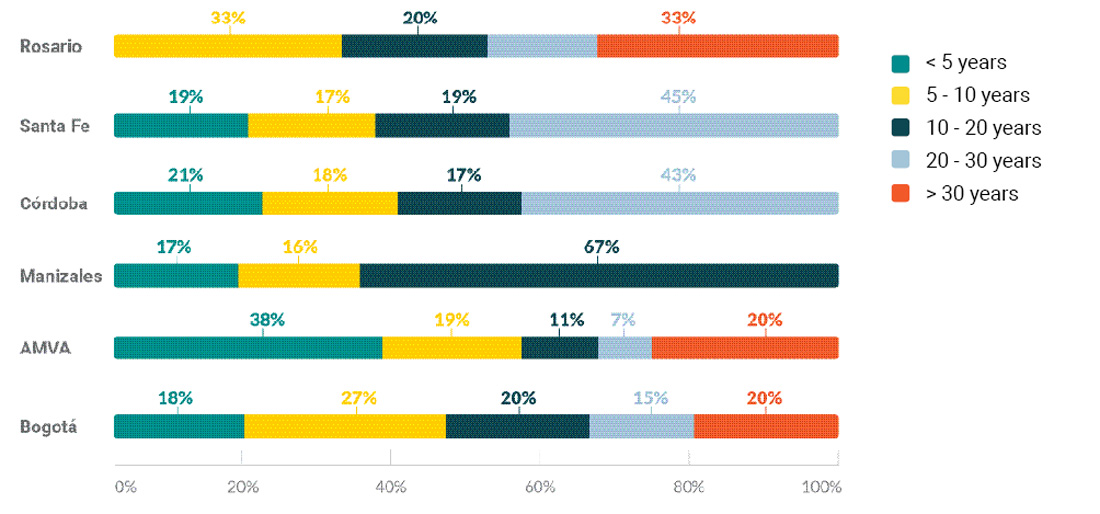
Figure 4: Share of freight vehicles by vehicle age in Argentina and Colombia. (Source: Área Metropolitana del Valle de Aburrá, 2018; Manizales Cómo Vamos 2020)[2]; Córdoba: Municipalidad de Córdoba; Bogotá, Sata Fé and Rosario: information provided by respective cities. The figures were extrapolated to enable comparison.)
As displayed in Figure 4, around 55 percent of Bogotá’s vehicle fleet is older than 10 years and 20 percent of the total vehicle fleet is older than 30 years. In AMVA, more than 25 percent of the vehicles are older than 30 years.
Figure 5 and Figure 6 provide a more detailed analysis of the average age of the fleet by vehicle type in these two cities. In Bogotá, light goods vehicles (LGVs) weighing less than 3.5 t and trucks with a GVW between 3.5 t to 18 t are the oldest vehicle type, whereas in AMVA dump trucks have an average age of 15.3 years.
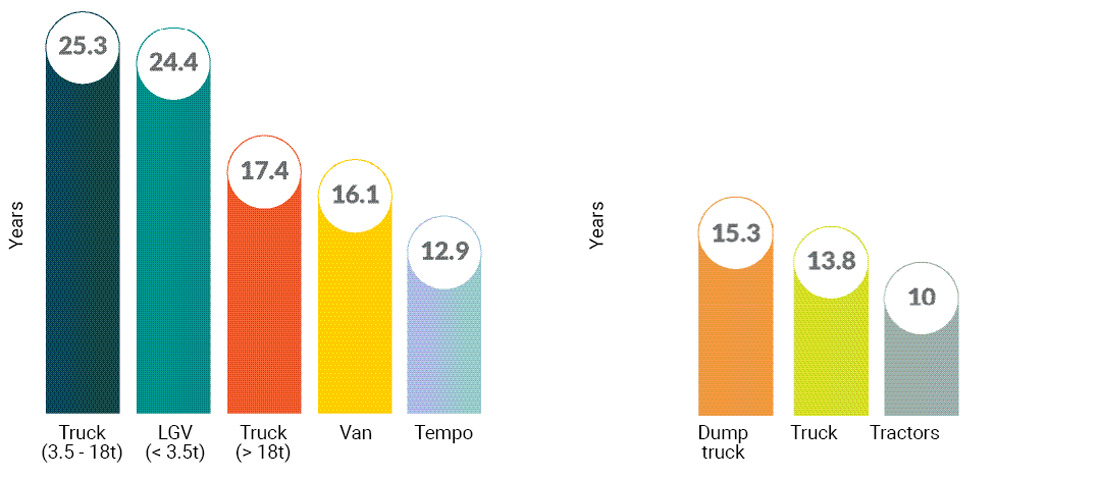
Figure 5: Average age of the freight vehicle in Bogotá. (Source: The Secretariat of Mobility in Bogotá, 2019)
Figure 6: Average age of the freight vehicle in AMVA. (Source: Área Metropolitana del Valle de Aburrá, 2018)
An older vehicle fleet means that technology advances found in more modern trucks such as environmental, safety and intelligent transport systems have not been introduced. However, this figure does not specify if these vehicles are performing in urban areas, where health affects resulting from exhaust emissions are most severe. With forecasts predicting an increasing number of freight vehicles and its adverse impact on air pollution, AMVA has set out a renewable policy for freight vehicles and plans to accelerate the phase-in of ultra-low and zero-emission vehicles.
Figure 7 shows that in three Argentinian cities, coupled vehicles and trailers are the oldest type of vehicle on average of the fleet, around 18.4 and 24.5 years of age on average, respectively. In comparison, the average age of vans in Europe is 10.9 years, and the average age of heavy commercial vehicles is 12.3 years (ACEA 2020).
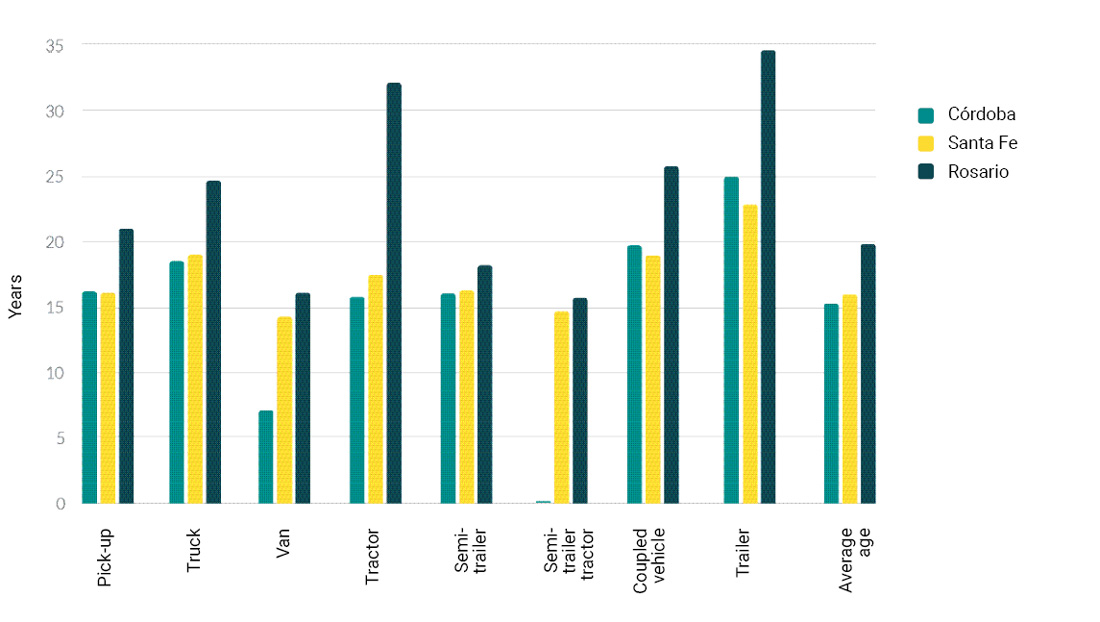
Figure 7: Average age of the freight vehicle in Argentina. (Source: Córdoba: Municipalidad de Córdoba; Santa Fé and Rosario: Information provided by each respective city. The figures were estimated to enable comparison.)
The Share of Freight Vehicles by Fuel Type in Bogotá and AMVA
Fuel use of the registered freight vehicle fleet in Bogotá and AMVA are presented in this section, categorized by vehicle weight class. Fuel use of the vehicle fleets in other cities is not addressed in this report and may be added in the future updates as new information or data becomes available.
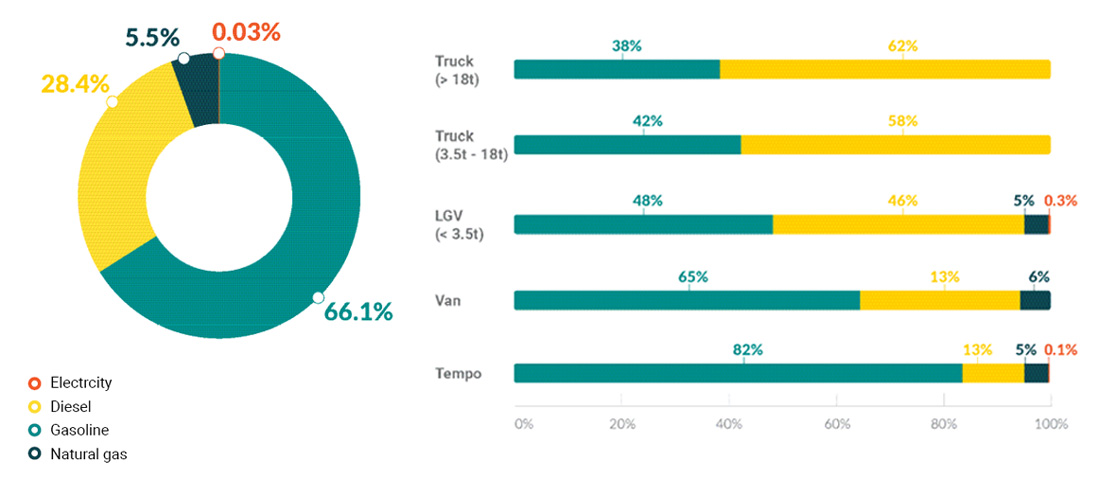
Figure 8: Distribution of fuel use in Bogotá. (Source: The Secretariat of Mobility in Bogotá, 2019)
Figure 9: Distribution of fuel use by vehicle type in Bogotá. (Source: The Secretariat of Mobility in Bogotá, 2019)
As seen in Figure 8 and Figure 9, in Bogotá, the use of gasoline plays an important role, accounting for two-thirds of the total freight vehicle fleet. Gasoline use is largely confined to smaller vehicles: 82 percent of the tempo fleet, 65 percent of the vans, and 48 percent of the LGVs use gasoline as the primary energy source. The share of gasoline use in the freight vehicle fleet gets smaller as the size of the trucks increases. Approximately 28 percent of the vehicle fleet is powered by diesel, while the share of natural gas use constitutes 5 percent of the entire freight vehicle fleet. Around 59 electric vehicles are in operation – almost exclusively tempos and LGVs, indicating that the uptake of electric freight vehicles, especially heavy-duty vehicles, is still at a very early phase in the city.
Furthermore, it is shown that natural gas is the dominant fuel type for smaller freight vehicles in the city while diesel is the primary energy source for heavier vehicles (see Figure 8).

Table 2: Fuel use of the registered freight vehicle fleet in AMVA (Source: Área Metropolitana del Valle de Aburrá, 2018)
When it comes to the typical fuel types consumed by the vehicle fleet in AMVA, Table 2 shows that, the majority of the fleet is currently diesel-driven (approximately 76 percent), while 14 percent runs on CNG, and a small fraction of the freight vehicle fleet runs on gasoline. For tractors and dump trucks, nearly all oil use is diesel-based due to the higher energy density of the fuel and efficiency of diesel engines in heavy duty vehicles.
Urban Freight Traffic Flows in Bogotá, AMVA and Kochi
Urban freight traffic flows are characterized by the freight movements in the city. Data about the freight traffic flows is available in Bogotá, AMVA and Kochi, and is presented in the following section.

Table 3: Freight trips in Bogotá (2015) and AMVA (2019) (Source: Secretaría Distrital de Movilidad de Bogotá, 2017; Universidad Nacional de Colombia sede Medellín, 2019)
As seen in Table 3, in terms of the freight carried on journeys to, from, within and through the cities, it has been estimated that on average 240,586 tonnes of goods are carried on a daily basis in Bogotá: with 54 percent by weight of the total freight lifted on journeys to the city and 46 percent from the city, according to the 2015 Origin-Destination (O-D) survey in Bogotá (Secretaría Distrital de Movilidad de Bogotá, Directora de Estudios Sectoriales y de Servicios 2017). In AMVA, according to the latest O-D freight survey (Universidad Nacional de Colombia sede Medellín 2019), 227,491 tonnes of goods are transported on a business day. Of this, 144,148 tonnes of goods are carried on journeys within the region (intracity), accounting for approximately 63 percent, followed by intercity inbound trips with 19 percent, and 18 percent outbound.
With regards to the number of freight trips, in Bogotá freight trips are mainly generated from the industrial corridors in the south and west of the city, as well as the business and commercial areas in the city center. It is estimated that on average, approximately 158,000 freight trips are made on a weekday within Bogotá’s administrative limit. Of the trips, 4 percent is through traffic, whilst the vast majority is completely within the city (62 percent); 17 percent of the freight vehicles originate their journey in the city, and 17 percent end it in the city. In AMVA, the majority (88 percent) of the freight trips had its origin and destination in the metropolitan boundary. The O-D survey also shows that the commercial sector generates the majority of the daily trips, reaching 20,949 daily trips, followed by the service sector with 25,184 trips.
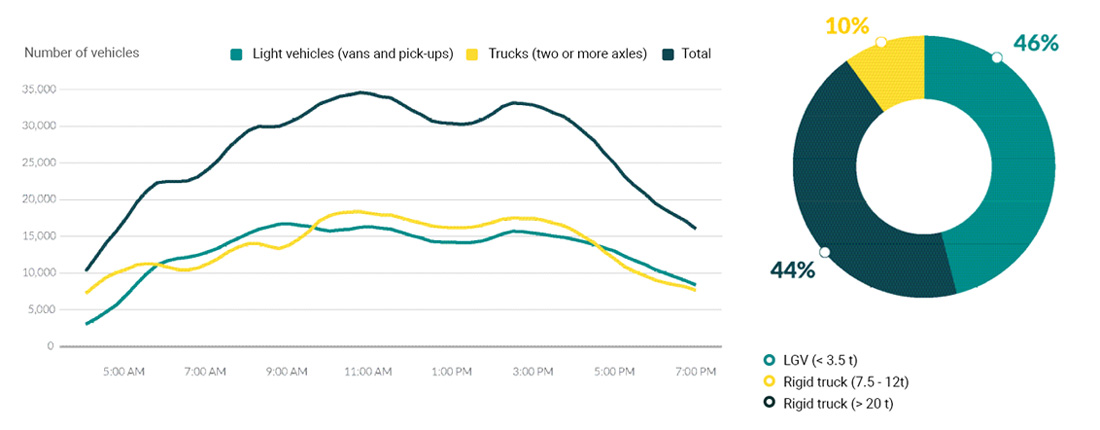
Figure 10: Hourly freight traffic on a business day in Bogotá. (Source: Secretaría Distrital de Movilidad de Bogotá, 2017)
Figure 11: Distribution of freight vehicles used for transportation of goods in Kochi. (Source: ICLEI / The Urban Lab)
It is also important to understand the composition of freight traffic during a day. As shown in Figure 10, in Bogotá, the volume of freight traffic on streets varies. Across the day, the number of trucks steadily rises and peaks from 10:45 a.m. to 11:45 a.m. The volume of vehicles then gradually decreases, but peaks again in the afternoon from 2:30 p.m. and 3:30 p.m. LGVs follow a similar pattern at a lower volume, but the peak is earlier (around 9 a.m.) and has a steadier drop throughout the day.
In India, freight traffic shows different characteristics. In Kochi, freight data is sourced from the Comprehensive Mobility Plan(2015), which includes traffic data captured through Classified Vehicle Counts (CVC) at 11 cordon points, road side interviews and CVC at 24 junctions within the Greater Cochin Development Authority (GCDA)[3].
According to the CVC at cordon points, out of the total urban traffic entering the city, the share of freight vehicles is around 14 percent. Moreover, approximately 46 percent of the freight trips are performed by smaller vehicles, including 3- and 4-wheeler rickshaws, pick-ups, vans, tempos and other light goods vehicles, followed by trucks and two-axle vehicles (3.5 t – 12 t) with 44 percent (Figure 11). Multiaxle vehicles (MAV, 12 t – 20 t) account for 10 percent of the freight traffic.
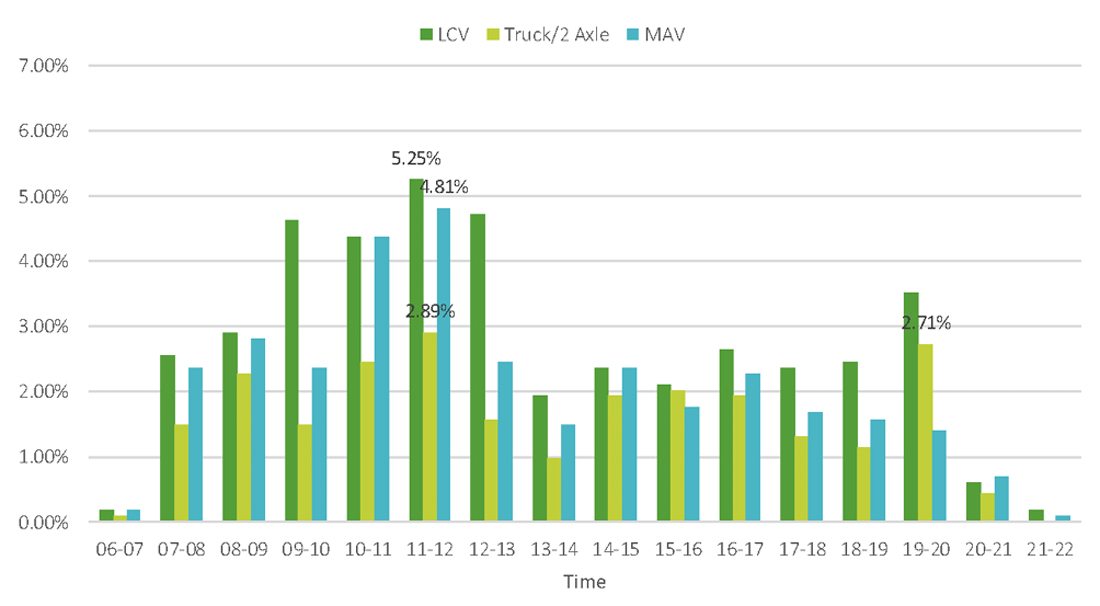
Figure 12: Freight vehicle entering Kochi during different time periods. (Source: ICLEI / The Urban Lab)
In terms of the distribution of freight traffic in a day, the screen line survey of vehicles depicts the relatively high hourly movement of goods entering the city is from 11 a.m. to 12 p.m. and from 7 p.m. to 8 p.m. The volume of vehicles plying within the city boundary during these periods might create a substantial impact on urban traffic movement. Figure 12 illustrates the maximum per hour trips from all modes of freight transport (i.e., 5.25 percent by LGVs, 2.89 percent by trucks and 4.81 percent by MAVs).
Vehicle Kilometers Travelled (sample)
The following sections present road freight transport in the project cities regarding vehicle kilometers travelled (VKT), freight transport activity in tonne-kilometer, utilization of vehicle capacity, as well as environmental performance including fuel consumption and baseline emissions. The data is drawn from the surveys conducted among local stakeholders and is extrapolated to enable comparison, therefore must be treated as estimates. VKT measures the total annual distance performed by a given fleet. It is an important indicator to assess its impact on the urban road network and environmental impacts.
The figure below compares VKT by vehicle type in the surveys conducted in Argentinian and Colombian cities, as well as two Indian cities. The distance obtained for each city depends on the size of the city and on its involvement in intercity transport where longer distances are travelled. It should be noted that the available information of VKT consists of indirect estimates based on various sets of assumptions.
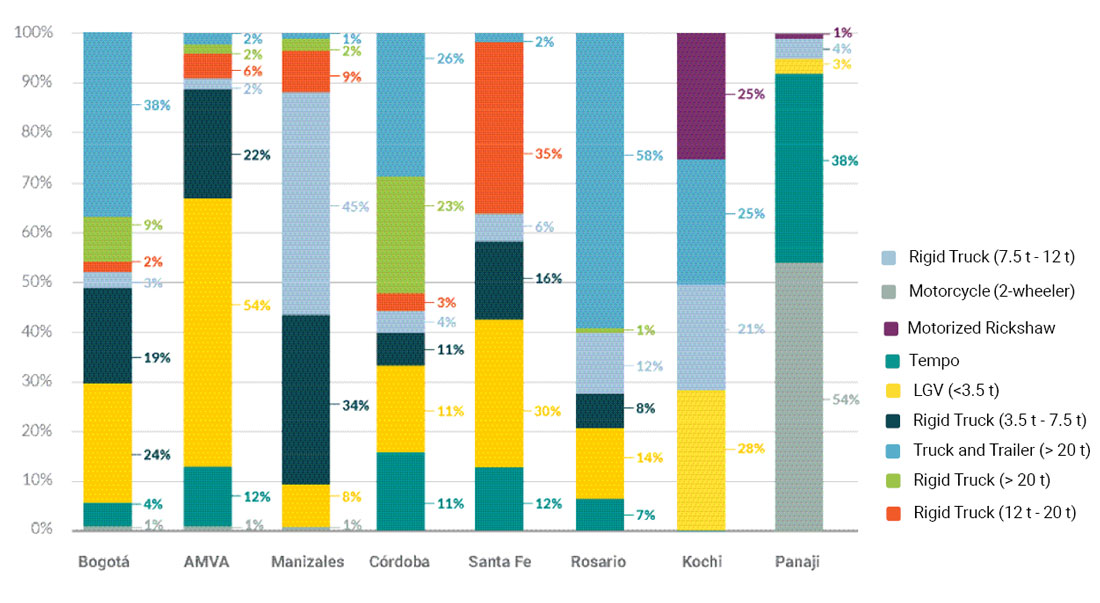
Figure 13: Distribution of vehicle distance travelled by vehicle type in the cities. (Source: ICLEI / Despacio / The Urban Lab / SGArchitects). Note: In Argentina and Colombia, VKT is estimated based on the simple vehicle fleet; In India, VKT is extrapolated based on freight data captured through classical vehicle counts at cordon points and junctions.
Figure 13 shows that in Bogotá, heavier trucks (> 3.5 t) account for a sizeable share of VKT, despite much lower shares in the registered vehicle fleet (see Figure 1). This is because heavy vehicles typically serve long-haul delivery of goods, resulting in higher mileages.
In AMVA, it can be observed that nearly twothirds (66 percent) of these kilometers were performed by smaller vehicles weighing less than 3.5 t within the regional administrative boundary. In Manizales, a significant share of the VKT is performed by heavier vehicles (> 3.5 t) – approximately 89 percent.
In Argentina, differences exist in the three cities. In Córdoba, rigid trucks more than 20 t as well as truck and trailer account for nearly half of the total VKT; whilst in Santa Fe, the rigid truck (12 t – 20 t) makes up a large share of 35 percent. In the port city Rosario, truck and trailer account for 58 percent of the VKT.
It is estimated that more than 4 million tons of oilseed, grains, and agricultural by-products arrive every year at the Port of Rosario, which explains the high number of VKT driven by truck and trailer (> 20 t)[11]. The truck drivers often bypass the city center through ring road Avenida de Circunvalación 25 de Mayo, alternatively, they cross the city, especially in the southern zone.
In Kochi, the VKT is rather evenly distributed, 38 percent by LGVs, 28 percent by rigid trucks (7.5 t – 12 t) and 34 percent by truck and trailer (> 20 t). In Panaji, more than half (54 percent) of the VKT is driven by two-wheelers, followed by LGVs with 38 percent. This is because two-wheelers are commonly used for freight trips from/to establishments, and most of the distances covered by two-wheelers are for deliveries from hotels and restaurants.
Road Freight Activity in Terms of Tonnekilometer (sample)
The activity of on-road freight vehicles is typically measured in tonne-kilometer (tkm), which is useful to express freight transport efficiency. However, information about shipment weight and distance can be urprisingly difficult to capture.
For the purpose of this report, the total tkm is estimated using the EcoLogistics Selfmonitoring Tool, where standard values for load factor and empty running are embedded.
The default values are based on a particular set of assumptions and chosen from a larger set of possibilities available in the GLEC Framework (Smart Freight Centre 2019). It should be noted that the values might not be representative of the specific urban freight operations in the cities.
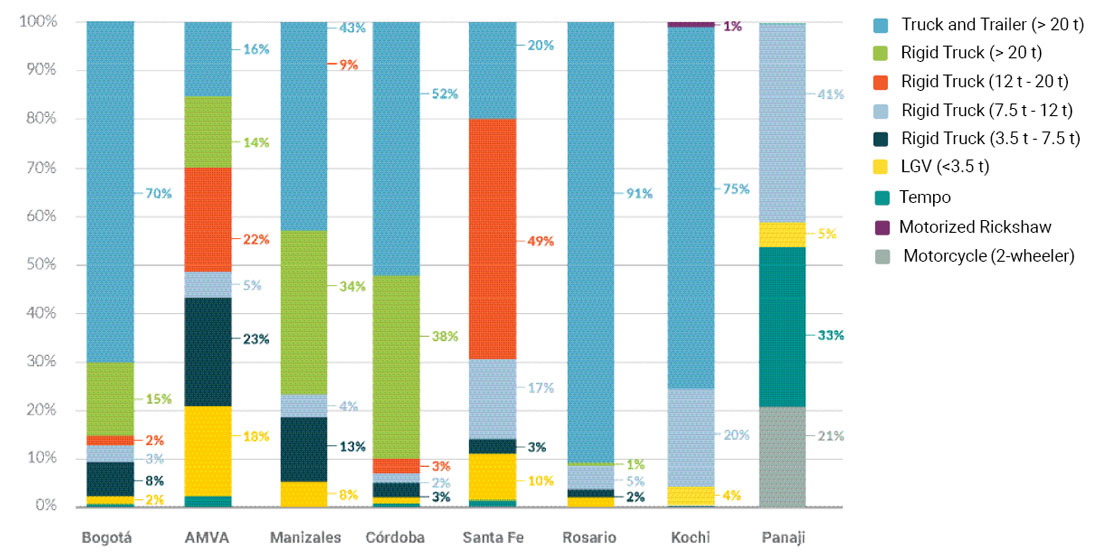
Figure 14: Distribution of tonne-kilometer of road freight transport in the cities. (Source: ICLEI / Despacio / The Urban Lab / SGArchitects). Note: In Argentina and Colombia, VKT is estimated based on the simple vehicle fleet; In India, VKT is extrapolated based on freight data captured through classical vehicle counts at cordon points and junctions.
It can be seen on Figure 14 that heavy duty vehicles have the largest share of road freight transport performance among all project cities. However, difference exists among cities. For example, in Panaji, rigid trucks (7.5 t – 12 t) account for 41 percent of the total freight transport activity, largely due to the transportation of soil using heavy tankers within the city. Nevertheless, the importance of two-wheelers and light goods vehicles in the city is evident – LGVs account for approximately a third of the total tkm while two-wheelers account for 21 percent. This is essentially linked to its city size and the freight trip characteristics. A detailed breakdown of freight deliveries within Panaji can be seen in Figure 15.

Figure 15: Breakdown of freight delivery within Panaji. (Source: ICLEI / SGArchitects)
Figure 15 shows that in terms of the distance travelled within the city boundary of Panaji, the majority of it is performed by two-wheelers, accounting for 53 percent, followed by tempos with 36 percent. Regarding the weight of the goods transported, the majority of the goods are delivered by HGVs with 40 percent, followed by tempos with 35 percent and LGVs with 12 percent. Furthermore, two-wheelers produce half of the total freight trips per day, including first-and-last mile delivery trips, as well as trips for sewage and waste collection. Tempos and LGVs produce a relatively big share of trips too, accounting for 32 percent and 10 percent, respectively.
Utilization of Vehicle Capacity in Panaji and AMVA (sample)
The utilization of vehicle capacity is an important indicator of operational efficiency. It is subject to the inter-functional relationship between transport and other activities such as production and warehousing. The underutilization of vehicle capacity is often unplanned and not based on any analysis of cost tradeoffs.
By improving loading, it is possible to reduce the amount of freight vehicle traffic required to move a certain freight, resulting in emission reduction and enhanced operational efficiency. Due to data availability, the section below only presents the load factors of freight vehicles in Panaji and AMVA.
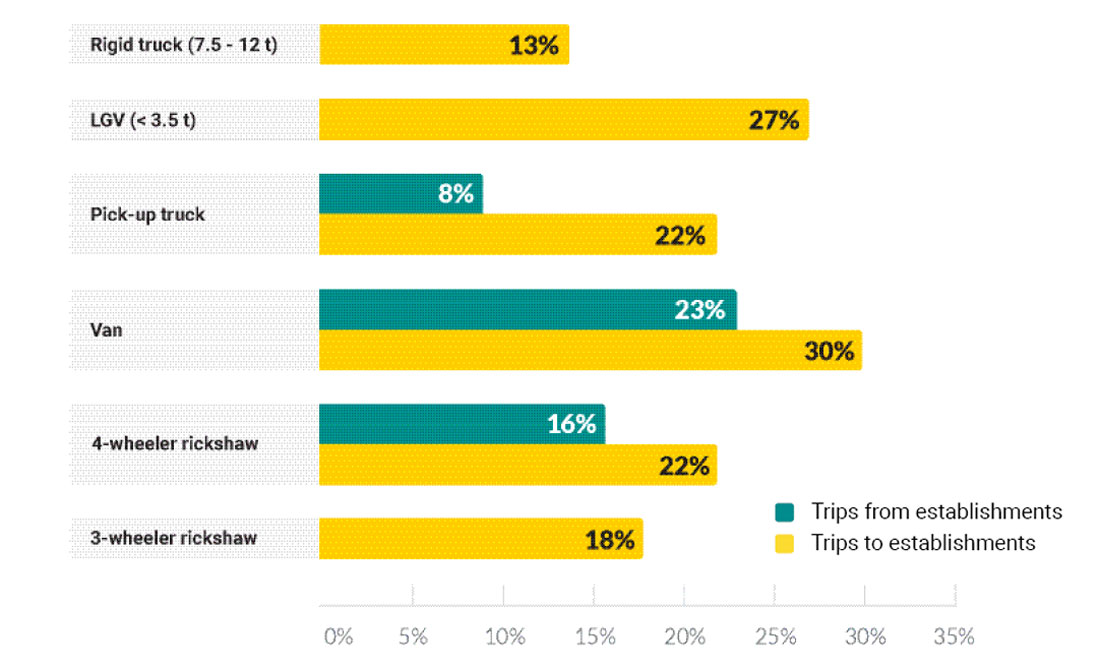
Figure 16: Average load factor of freight vehicles by freight trip in Panaji. (Source: ICLEI / SGArchitects)
In Panaji, analysis of data collected through primary survey suggests that most of the freight vehicles and freight trips operate at low utilization level (below 30 percent), leading to inefficiencies and additional trips. Figure 16 shows the average load factor for deliveries to retailers, as well as average load factor for home deliveries from retailers. It is suggested that the efficiency levels of freight trips from the establishments (to home) are much lower than that of trips to establishments (from distributors). There is therefore scope for improving the overall utilization of existing freight inventory in order to reduce the number of freight trips (freight traffic) and emissions from freight in the city.

Figure 17: Average load factor of freight vehicles in AMVA. (Source: Área Metropolitana del Valle de Aburrá, 2019)
In AMVA, findings show that load factor in urban freight transport is relatively low, ranging from 9 to 41 percent (Figure 17). The lowest rates are with vans (0.75 t – 1.5 t) and trucks with a GVW between 3.5 and 7.5 tons. Trucks and trailers (7.5 t – 18 t) have the highest load capacity of 41 percent.