


Depopulation has a tangible effect on the built environment of cities and regions across Europe. Once vacancy becomes socially unsustainable, a decision has to be taken whether to invest or leave the affected building stock. To invest in or divest from shrinking cities is the difficult question we’ve been asking local policy makers. Divesting because depopulation is the tangible outcome of no demand for inhabiting a city. Investing because the demand is low where the investment is low. With this text, we lay the foundation for expanding the debate and share a few learning points from the data-rich case of Estonia.
What We Talk about When We Talk about Shrinkage
When we talk about shrinkage, we tend to think about the rapid population decline of a city. Initially, the term was used to describe the population decline in post-socialist cities struggling with the privatisation of national industries. The problem with relying on this definition in our research was that, in practice, “shrinking cities” has become an umbrella term that masks the complexity and ground-truths of social change and urban transformation.
When we talk about shrinkage, we are also talking about a shared, Europe-wide experience – one that, notably, feeds into national politics in increasingly lurid ways. By 2011, over 40% of European regions were experiencing depopulation according to EPSON.
The triggers for shrinkage have also changed. European cities have long passed the privatisation issues of the post-socialist era. Today, relocations and empty villages are studied in the context of an (unequal) green transition, automation and plaorgary urbanisation.
This depopulation and the perception that it has been unaddressed have taken hold in our political imagination. In Spain, for example, the Teruel Existe platform became a political party in the wake of protests demanding the fair and equal treatment of “Empty Spain” in 2019. Its success inspired the establishment of the party, España Vaciada (Empty Spain), which has seen electoral success in regional elections. And Spain is not an isolated case. In Italy, a €420 million recovery fund, for which villages compete, has ushered in charged perceptions of unfair treatment toward the shrinking cities of “Empty Italy.”
The Case of Estonia
Trends in Estonia’s population figures have remained stable over the course of the past few decades. After lukewarm growth in the 1990s, today’s population is the same as it was in the 1970s despite the GDP more than tripling. Public and policy discourse suggests that some cities are shrinking in Estonia, even though the overall population has remained stable. To investigate this, we mapped the population change for all of Estonia’s municipalities, relative to the national trend, from 2015 to 2021. The six-year period showed a clear trend. The metropolitan regions of Tallinn and Tartu experienced population growth, while the other areas experienced population decline. More precisely, it is not Tallinn and Tartu that have grown in population compared to the national trend but rather their commuter belts.
This presents a renewed demand for suburban rather than urban living, and it poses an even greater challenge for urbanists as this comes with increasing dependency on automobiles.
A Surprising Turn
In Estonia, shrinkage has long been discussed and studied from a demographic, economic and social perspective – from the periodic prognoses issued by Statistics Estonia to the most recent OECD report “Shrinking Smartly in Estonia”.
In 2018, the Estonian Ministry of Finance received dozens of apartments from Ida-Virumaa after the municipality of Kohtla-Järve informed citizens and apartment associations that they could transfer unwanted apartments to the state.
The gifting of unwanted apartments was a turning point and a surprise, particularly given that, at the time, interest rates were low or negative and housing prices were on a steady rise. The year-on-year cost of housing increased by 4.9% in 2017, 5.7% in 2018 and 8.2% in 2019.
In 2019, the Ministry of Finance commissioned a pilot study to build a new methodology for mapping and studying shrinkage at the building level. This revealed that vacancy was reaching alarming rates in both urban and rural areas, and that highly vacant buildings tended to be clustered together. By alarming rates, we mean that a building would be at least 25% empty over the course of a year.
Scaling Up
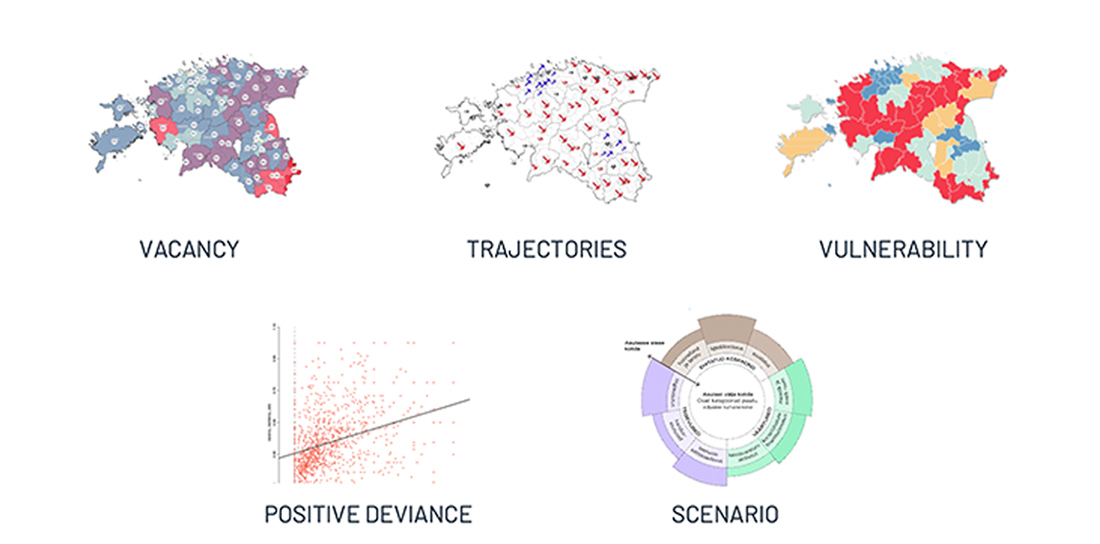
In 2021, the Ministry of Economy ordered the pilot to be scaled up to the national level. The core questions were, “What are the shrinking patterns in Estonia?” and “What are the most vulnerable areas and building types?”
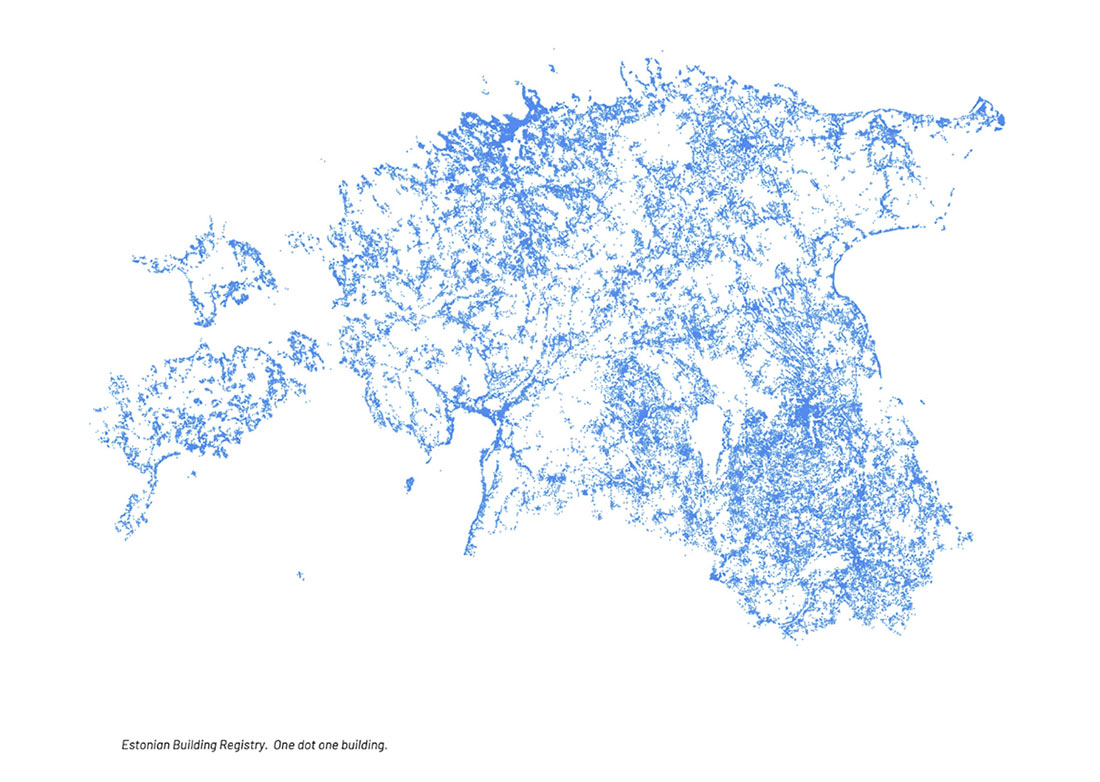
Data was crucial. Over the course of seven months, we worked closely with the Ministry of Economy, Statistics Estonia, and the Estonian Data Protection Agency to collect, validate, aggregate, and categorise vacancy data for apartment buildings and single family houses. The core datasets gathered were the building vacancy according to the annual electricity consumption in 2019 and the building vacancy according to the population registry between 2013 and 2020.
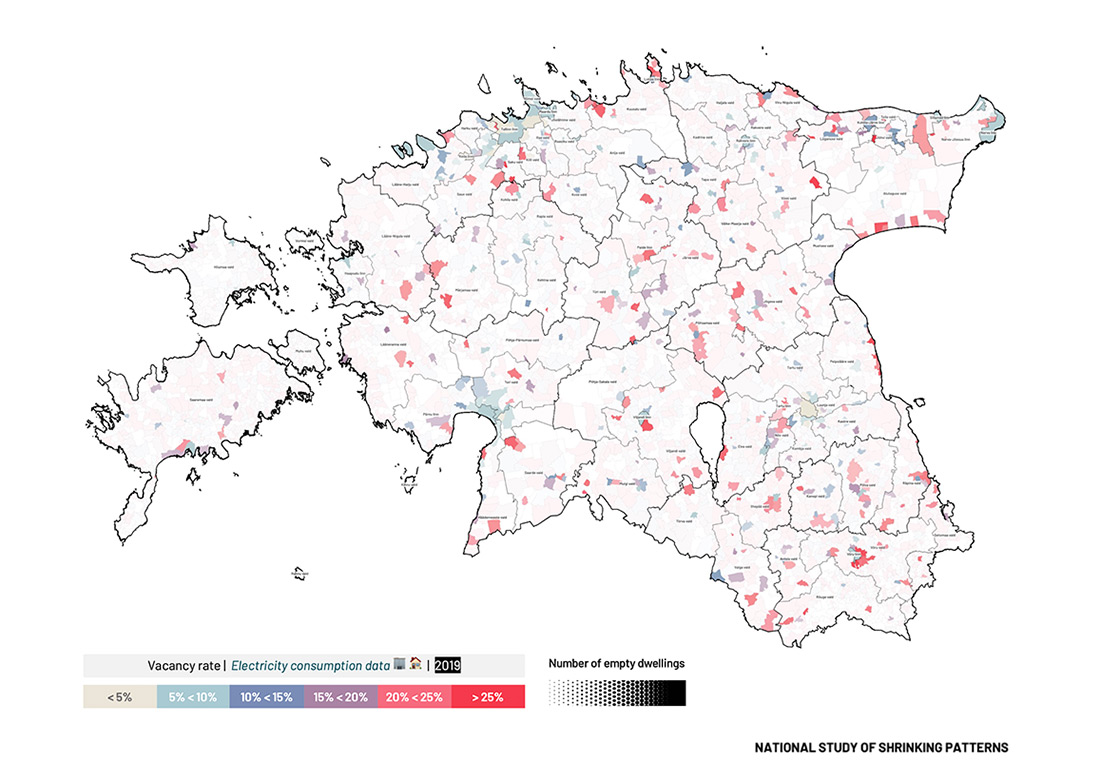
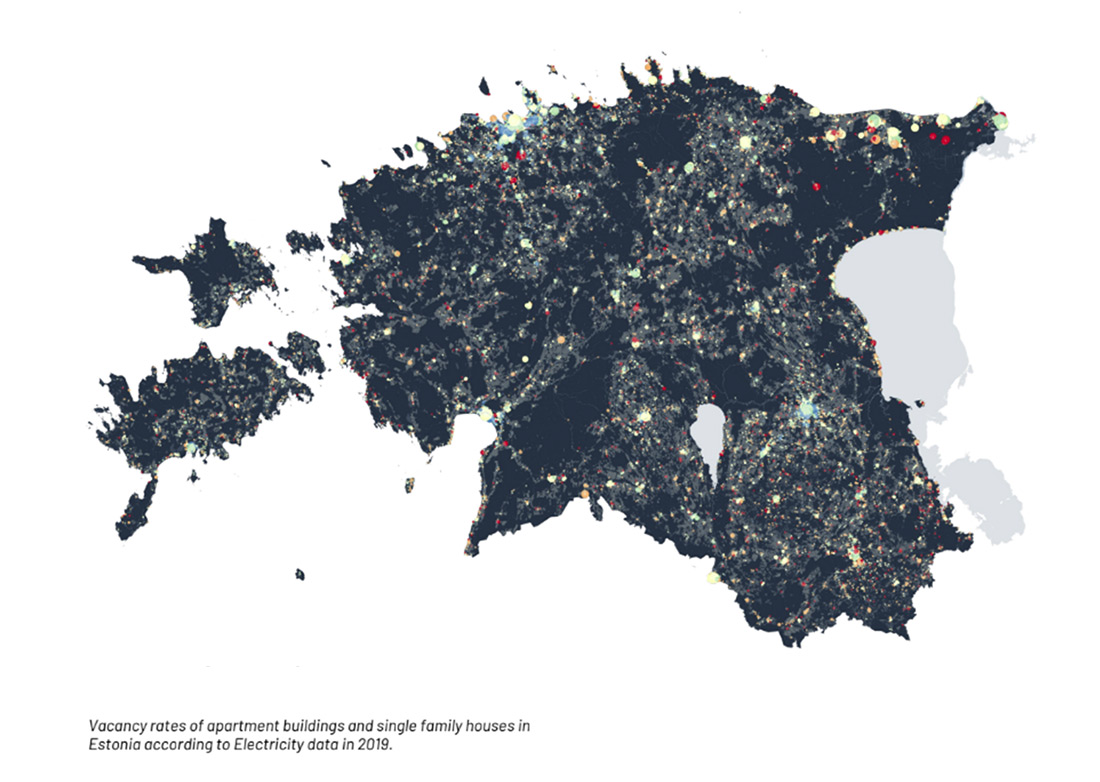
Vacancy
The emergence of the first vacancy map of Estonia offered an entirely new picture. According to the electricity data, 25 municipalities had a vacancy rate of at least 15% in 2019. In other words, in roughly one-third of Estonia’s municipalities, about one in six dwellings are empty.
We also found a sharp difference between the vacancy of single family houses and apartment dwellings. If you take the entire building stock of Estonia, 7% of apartment dwellings are vacant, compared to 12% of single family houses.
In cities with a growing population, apartment buildings are less vacant than single family houses. For shrinking cities, the opposite is true: apartment dwellings are more vacant than single family houses.
Shrinking Cities Are also Growing: Growing Cities Are also Shrinking
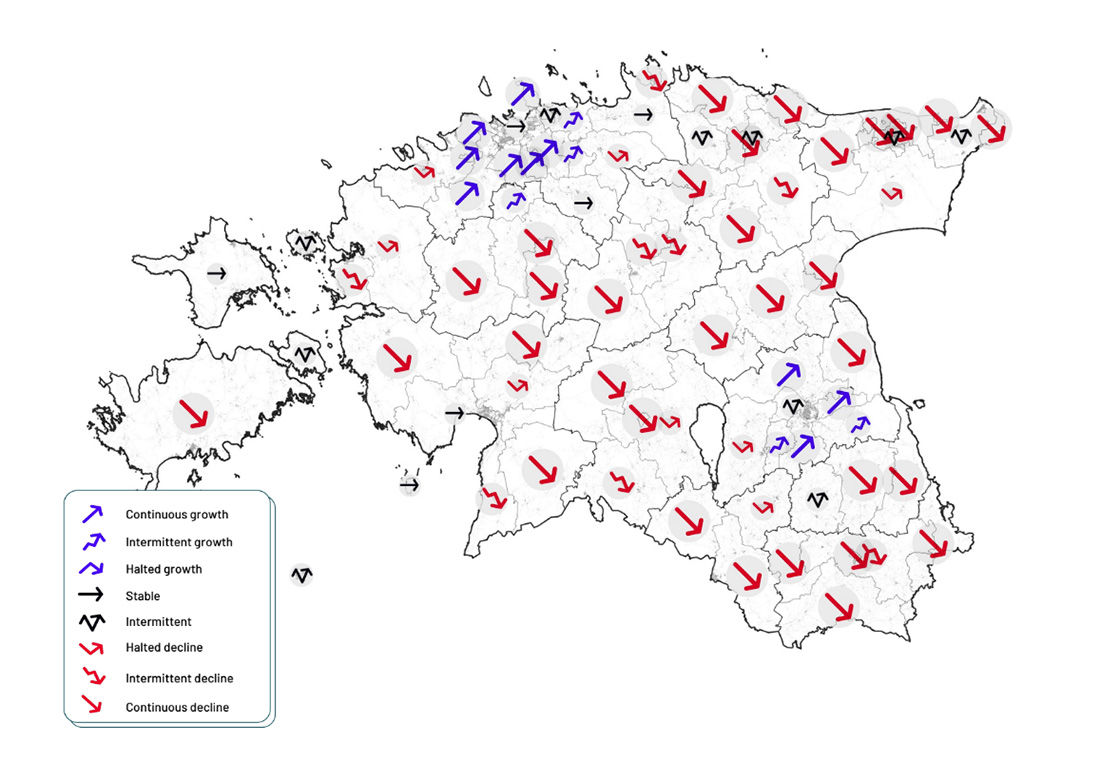
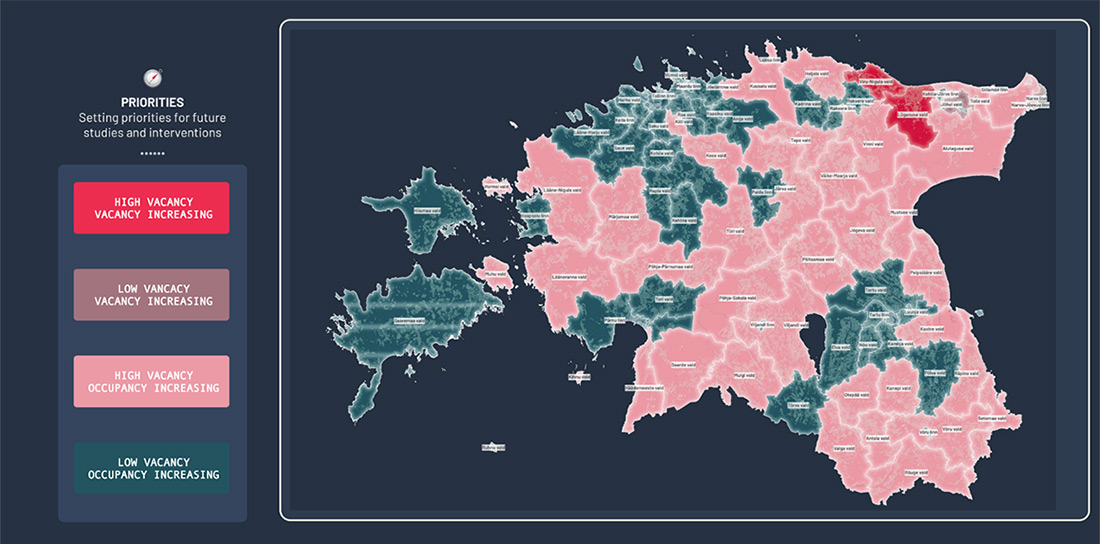
To understand the evolution of shrinkage, we studied vacancy across time: i.e., vacancy trajectories. These are charted as the change in the vacancy rate between 2013 and 2020 according to population registry data.
From this work, we learned that Estonia is on the path toward recovering from high vacancy rates with the exception of the Eastern region – Loksa, Viru-Nigula, Lüganuse, Sillamäe and Narva – where vacancy rates are not high, relatively speaking, but are increasing fast.
Overall in Estonia
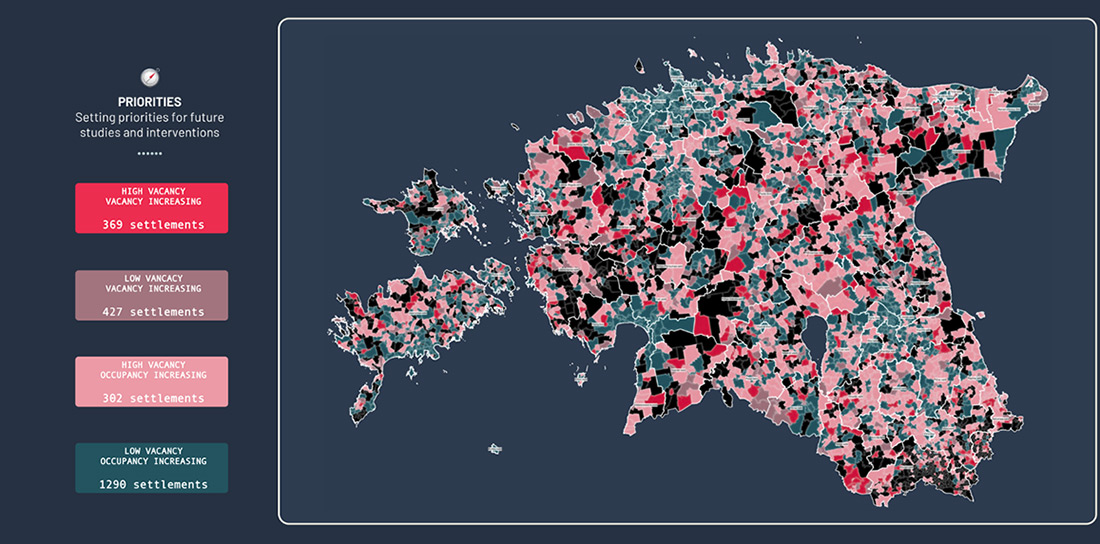
118 small towns are growing and 42 are shrinking – at least a 5% vacancy rate decrease and a 5% vacancy rate increase, respectively.
2,393 villages are growing and 362 are shrinking, with the majority of those shrinking doing so at a high pace: at least a 15% vacancy rate increase.
17 urban settlements are shrinking and 21 are growing.
A new picture was becoming clearer: the majority of Estonian settlements are growing – that is, experiencing declining vacancy rates over the last 7 years – but those that are shrinking are doing so at an especially fast pace.
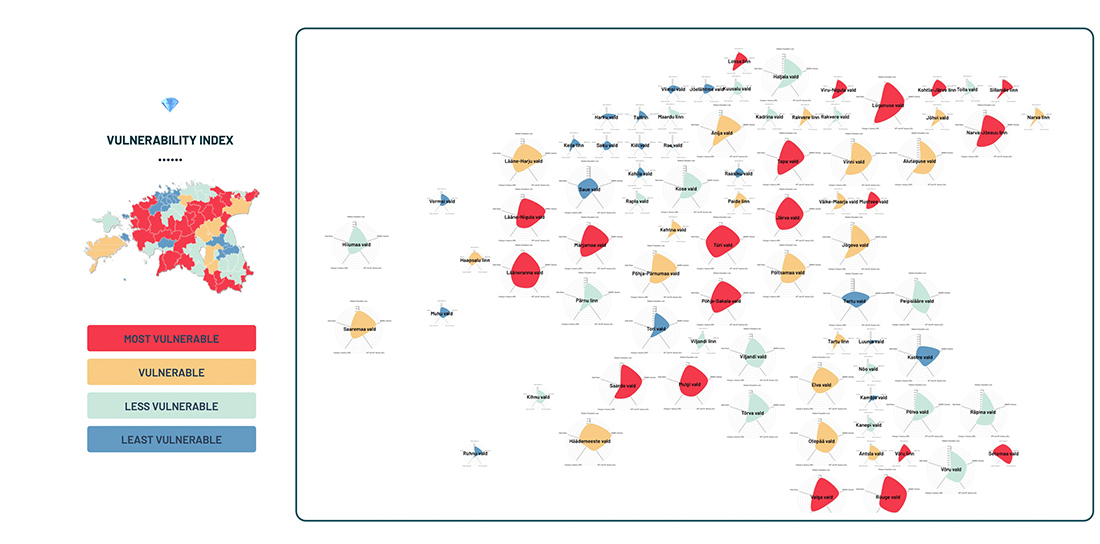
Vulnerability and Priority
As this research was being compiled, we started working with a steering group selected by the Ministry of Economy to begin studying the most vulnerable cities, those for which further research is urgent. This was done by setting up two key performance indicators: vulnerability and priority. Vulnerability indicates which municipalities may be most vulnerable to shrinkage from a governance perspective, based on a combination of five metrics: the vacancy rate, the change in vacancy, the change in the demographic labour pressure index (DEMLPI), the population decline relative to the national mean, and the municipal debt.
Vulnerability
The 20 most vulnerable municipalities are generally more isolated from more urbanized centres, such as Tallinn, Tartu, Narva and Pärnu. As for setting priorities for further research, the picture is rather similar to the vulnerability index. Currently, our research continues in Ida-Virumaa, where vacancy rates are both high and rising.
A Marie Kondo Dilemma
To start thinking about the future of cities affected by high vacancy rates, we need to move away from “shrinkage”. While the term has been useful in building an analytical framework for this project, how it is perceived remains detrimental to attempts to move forward and think more broadly and positively about the future of our cities; we cannot afford to fall into old traps.
The Estonian population is aging, and the size of the building stock is increasing. This means that much of the building stock will soon become redundant. We are facing a Marie Kondo dilemma: some things must go, and certain things should be kept and cultivated.
As we started mapping vacancy by building type, it became clear that small buildings with 3 to 9 flats were suffering from high vacancy rates, that these buildings – laden with cultural and architectural value – were becoming emptier everywhere except for Tallinn. In the majority of cases, buildings of this type were also located in blocks with rich and high-quality natural landscapes. In other words, we are losing part of the Estonian architectural heritage.