


The metropolitan region of NY-NJ is a delta within which the Hudson River, the East River, the Hackensack and the Passaic all converge. In this confluence a diversity of coastal and semi-inland flood landscapes appear. The team mapped these as separate categories of landscapes, because they respond to flooding in different ways and are accompanied by different risks and vulnerabilities to the urban environments that they host.

We could imagine the geomorphology of the estuary as a large mould onto which the metropolitan area has settled and where salt and fresh water are ex- changed every day, filling and emptying the low-lying area. During great floods the process becomes more intense and different flood landscapes respond to the pressure in different ways. The water does not overflow from the river in the same way as it overflows the marshes for in- stance, and planning will do well to take this difference into account. Our analysis has identified 5 types of coastal flood landscapes, represented by columns in the accompanying ‘hazard sandwich’ graphic.
The landscapes are coasts, tidal marshes, creeks, river floodplains and islands. Each of these coastal environments has distinct patterns of urbanism and resilience. In analyzing them we extend the Dutch Delta Works and Delta Alliance four-layer model of coastal development to five layers that include the cultural level of urbanism.[1] The conventional “Layer Model” includes a Base Layer of coastal eco-hydrologic processes, a Network Layer of infrastructural systems, and an Occupation Layer of human settlement and activities. The five types of coastal flood landscapes are elaborated below:
Coasts in this area are mostly sandy beaches with dunes, behind which in most cases they have relatively suburban, low-density pattern of development settled in a low-lying area. These areas are under full influence of the ocean and its waves. The currents form the shape of the coastline.
Tidal marshes are places where the wave force is relatively modest. Here salty water meets fresh water runoff from higher grounds and river discharge. They occur sometimes behind the dunes (Jamaica Bay); in other cases they appear in river deltas. In the Meadowlands, the Hackensack ends in a salty marsh. Marshes have only partially developed because every new building development needs to be accompanied by a land-making effort first. They are extremely vulnerable to both ocean and rainwater flooding. About 85% of the historical marshes have been lost to development handicapped by such vulnerability.
Creeks occur when a relatively small volume of fresh water flows through a clearly delineated section, and the alongside of the section is high enough to be dry. Creek beds occur on either side of the high ridge running parallel to the coastal line land inward. Development can occur without additional land-making investments. Creeks are vulnerable to ocean flooding. Because they have only limited tributaries and watersheds, they are less vulnerable to rainwater event inundation.
River floodplain. Rivers accumulate freshwater volumes from much larger watersheds and create a wide delta of floodplains where they discharge into the ocean. These floodplains are dynamic bodies that can frequently flood in a natural situation. In urban areas these places have been substantially urbanized along their edges. Also land has been reclaimed on these plains, often for water related activities like the harbor. These low lying urban environments along rivers are vulnerable to rainwater event flooding upstream as well as ocean flooding. When both happen at the same time consequences can be extremely severe.
Islands are naturally higher situated grounds surrounded by water. Depending on their height they can be prone to flooding. Mostly the edges of an island are most vulnerable, as can be seen at the lower tip of Manhattan where river discharge and ocean flooding meet. When as densely urbanized as Manhattan flooding is possible if the sewer system is inadequately wired and dimensioned.
Overall, the team has assessed that the full spectrum of flooding risks is highest along semi-developed marshes in urban areas. For that reason, both the Meadowlands, Hoboken/Eastern Jersey City have appeared in our initial priority areas. In the case of the Meadowlands, the construction of the 1921 Oradell reservoir upstream the Hackensack, the development waves in the floodplain, and the built up of surrounding areas, has exacerbated the risks to flooding of all kinds.


The Meadowlands region of New Jersey and New York is one of the nation’s large-scale coastal ecosystems and settlement systems. Although unique, it has relevance for other coastal urban industrial ecosystems such as Baltimore-Chesapeake Bay, Boston Harbor, New Orleans, south Chicago, Los Angeles, and Seattle. Solving design challenges in this region can thus generate wider precedents.
Resilience, as defined in the NRC’s Disaster Resilience:
A National Imperative, “is the ability to prepare and plan for, absorb, recover from and more successfully adapt to adverse events” (National Research Council, 2012, p. 1). Disaster risk reduction (DRR) research has developed dramatically in recent decades at every scale, from households to international development programs (National Research Council 2012; Wisner et al., 2013). Put simply, Wisner et al. have formulated disaster risk as:
DR = H x (V/C – M)
DR = disaster risk, which is a composite measure of exposure and vulnerability
H = hazards, which is the frequency, intensity, and duration of coastal storm processes
V = vulnerability to losses
C = capacity at the local scale for mitigating and responding to hazards
M = broader social mitigation of potential and actual losses

Mapping the risks and vulnerabilities across the region, for each of the coastal flood landscapes. This analysis yielded the Meadowlands as a priority investment area because of the confluence of risks and vulnerabilities.
Each of these terms is extremely complex in its details and uncertainties. The terms “risk” and “hazard” are sometimes confused with one another [2], and this team has opted to use the term “risk”. “Capacities” are less examined. For all of these reasons, it is extremely important to be clear about the analytic concepts, to build upon the most current thought about them, and to analyze how they can individually and jointly help understand disaster risk and risk reduction opportunities in the Greater Meadowlands region. Here is how we addressed each variable:
H – Hazard or Risk
Hazards or risks mapped include: storm frequency, intensity, and duration analysis; rainwater event flooding (sewer overflows); heat island effects with increasing temperatures; toxicity and pollution levels in ground, water and air.
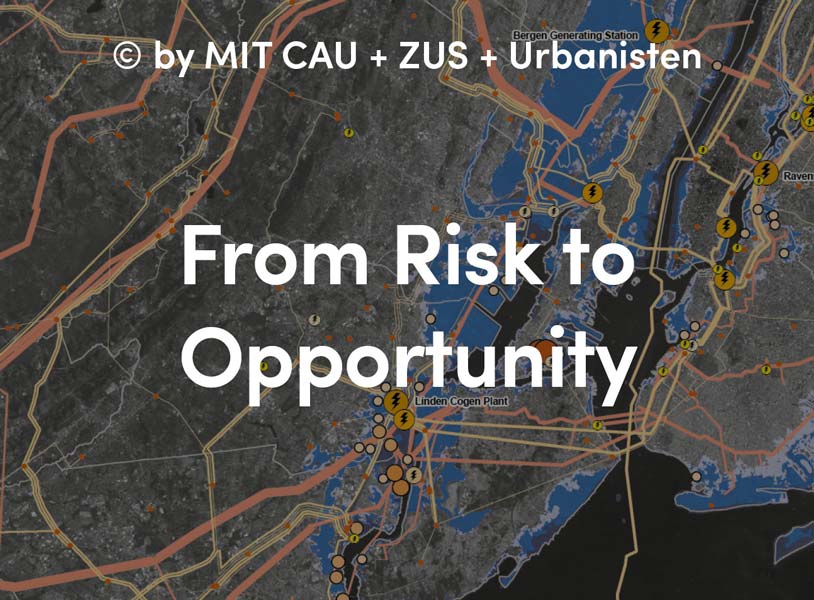
The team mapped the SLOSH models for current sea level rise and overlaid these with the updated FEMA maps. FEMA maps are conservative in that they do not factor in predicted sea level rise and precipitation increase. Led by Sarah Williams’ Civic Data Design group at MIT, the team approximated rudimentarily the estimated future hazard, by building out a 100-year flood map using a 2.5ft sea level rise, predicted by the SIRR report, as a baseline.
As far as the Meadowlands is concerned, violent wave action does occur in the southern edge of the Meadowlands com- mission area, as well as in South Kearny and the waterfronts of Jersey City. North of this area, Meadowlands flooding is likely and will increase in the future, but is more a function of gradual inundation rather than severe wave action.
Sewer overflow hazards were often captured in this flood risk map. However, they have begun occurring much more frequently over the past decades independent of ocean flooding (e.g. Little Ferry Main street flooding; Secaucus creek flooding). The main reasons are accumulation of impervious surfaces in the watershed (immediate runoff, no absorption in soil or marsh), and a gradual increase in precipitation itself. All together, about 2.5 million inhabitants in the New Jersey – New York metropolitan area live in the flood zone.
In addition, the team mapped existing and known pollution locations in the metro area. Clear concentrations in the Meadowlands area, as well as along Sandy Creek in Brooklyn became apparent. Not coincidentally, both locations have super- fund sites.
V – Vulnerability
Vulnerabilities mapped include: social vulnerability, vital network vulnerability, economic vulnerability.
This crucial dimension of risk has advanced from analysis of hazards to underlying social processes of poverty and marginalization. The Social Vulnerability Index (SOVI) developed by Susan Cutter [3] includes 32 variables and is the broadest multi-variate assessment available. We map the SOVI values in the greater Meadowlands region in attached maps. Social vulnerability (SOVI) was mapped against urban density in order to understand which of the vulnerable areas contains greater concentrations of people at risk. Mapping the locations of these communities taught us that altogether about 66% of the most socially vulnerable communities live within 1⁄2 mile of the flood zone in the metropolitan area.
The team mapped vital network vulnerability by identifying the following critical infrastructures in the flood zone: power (sub)station, sewage plants, major trunk lines for transportation, oil tanks, airports, police and fire stations. The team mapped and learnt that about 75% of the region power generation lies in the flood zone.
The team mapped economic vulnerability by identifying primary employment areas, specifically warehousing districts in the flood zone. Warehousing districts offer jobs to low-mod income families; while being critical stations in a supply chain to get goods to Manhattan and other parts of the metro area.
C – Capacity
Whereas vulnerability has received increasing research attention in recent years, the capacities and capabilities for mitigating and effectively responding to disaster have been less fully specified [4]. Early research addressed them as aspects of “choice” and “decision-making behavior,” while later research underscored how some social groups have far fewer choices than others. One of the key contributions of design is what hazards researcher Gilbert F. White called, “Expanding the range of choice” (Wescoat, 1987; White, 1960; Mitchell, 20xx) [5] . These choices includes access and mobility, work and recreation.
M – Mitigation
Capacity and mitigation are closely related. Mitigation refers to action taken in advance of a disaster to reduce its impacts on society and environment. The Federal Emergency Management Agency’s shift from disaster response to mitigation in
the 1990s was one of the most important policy shifts in the field of disaster risk reduction. The entire proposal that forms the content of this report can be seen as an advancement of this policy.
The team engaged in intense spatial mapping of these terms for the metropolitan region in order to identify to maximum overlap areas requiring priority investment. Risks and vulnerabilities are represented as color-coded rows in the accompanying ‘hazard sandwich’ graphic. Sarah Williams, MIT Professor and in charge of the ‘Civic Data Design Lab’ put together a team of experts for this mapping exercise, with assistance of Professor James Wes- coat, who assisted with this segment of the report. There are many uncertainties associated with each of these variables, which need to be examined closely. It is also important to stress that while expressed as a formula, this is not a technique for quantifying risk. Rather, this formulation helps organize the analysis of disaster risks and risk reduction in areas like the Greater Meadowlands Region.
Opportunity Testing
The team engaged in a continuous effort, even early on during the mapping phase, to understand the potentials of sites and areas to host an innovative design effort and stakeholder platform. For that reason, we engaged both in preliminary designs, as well as in early analysis of ongoing pro- jects and efforts in different areas. Again the Meadowlands basin delivered some promising elements, such as the presence of an inter-municipal zoning agency, a sense of discontent with the status quo, a variety of low-and moderate income com- munity, and a sizeable economic engine in the warehousing districts, supplying jobs to above mentioned communities.
Meadowlands-specific Risks and Vulnerabilities
The team also reiterated the risk and vul- nerability analysis at a finer grain within the Meadowlands area, yielding a series of substantive numbers of at risk properties, neighborhoods, and landscapes. These can be found in the overview matrix.