Skip to content

Audio Version

See more about

More info

Project director: Laura Kurgan | Data analysis and data visualization: Juan Francisco Saldarriaga | Design development and D3 interface: Annelie Berner and Scott Murray

Port to Port

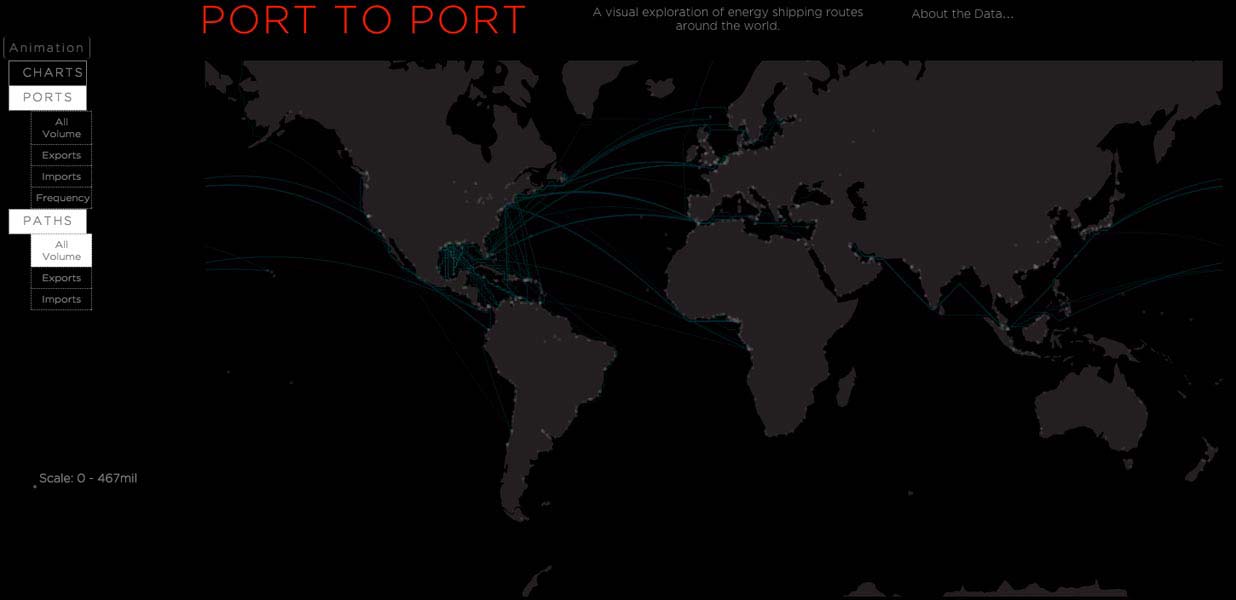
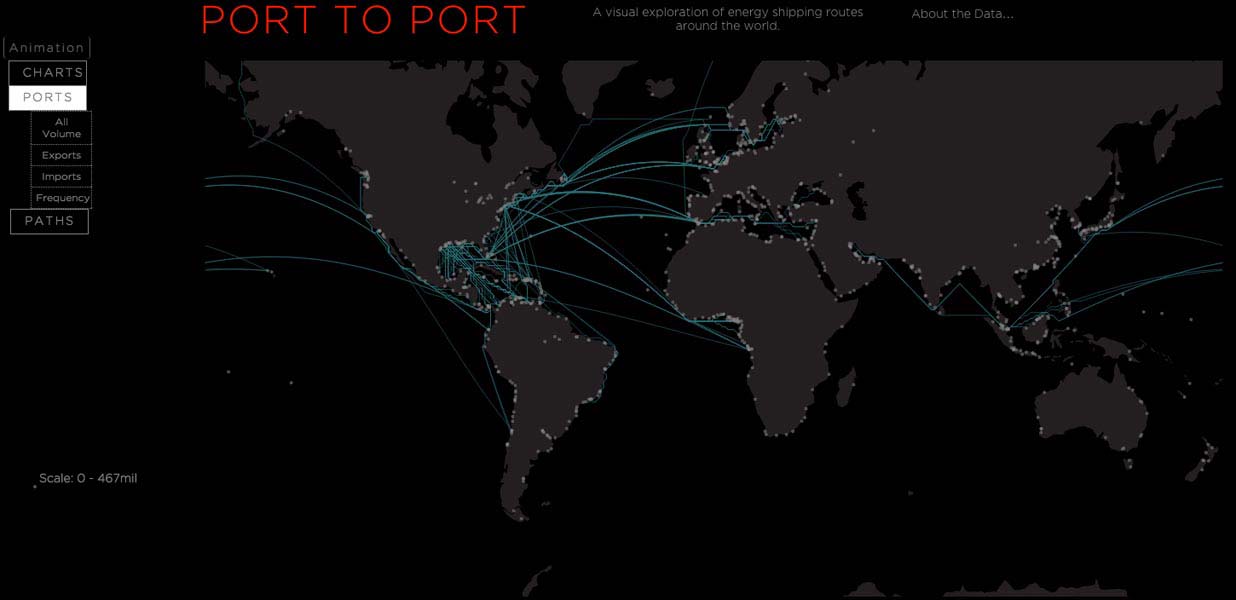
A visual exploration of energy shipping routes around the world.

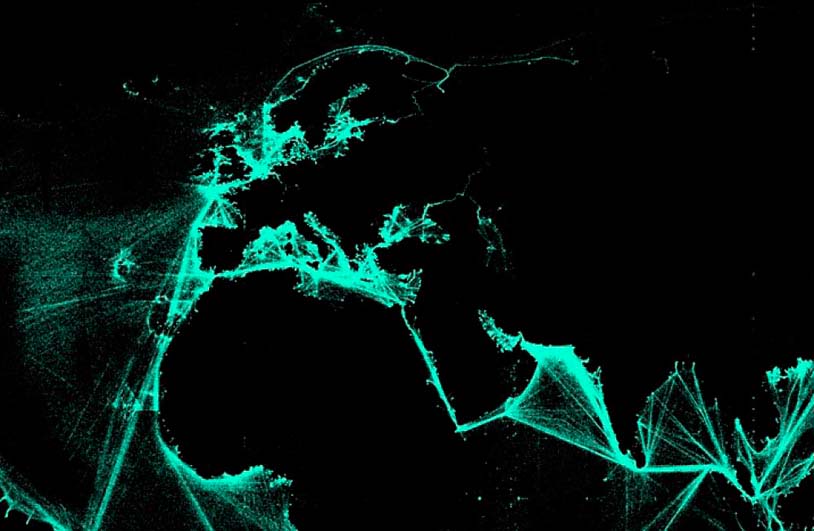
90% of all goods worldwide are moved by ship, but shipping is mostly invisible.
More than 300 million Metric Tons of energy are shipped in and out of the United States each year, in 60,000 shipments.
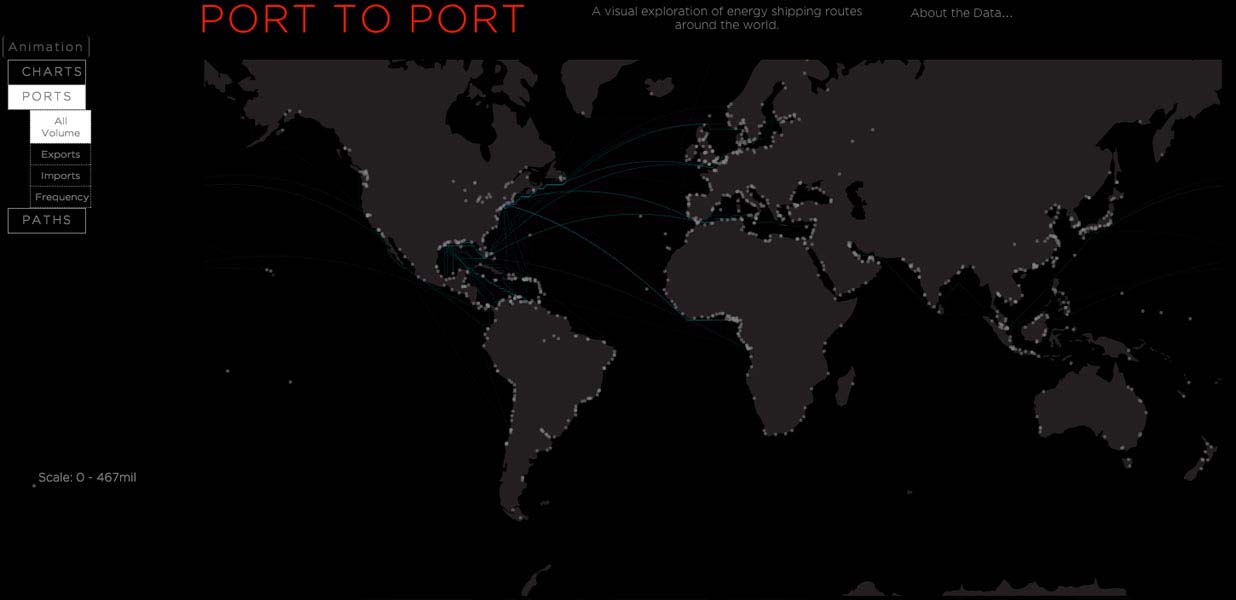
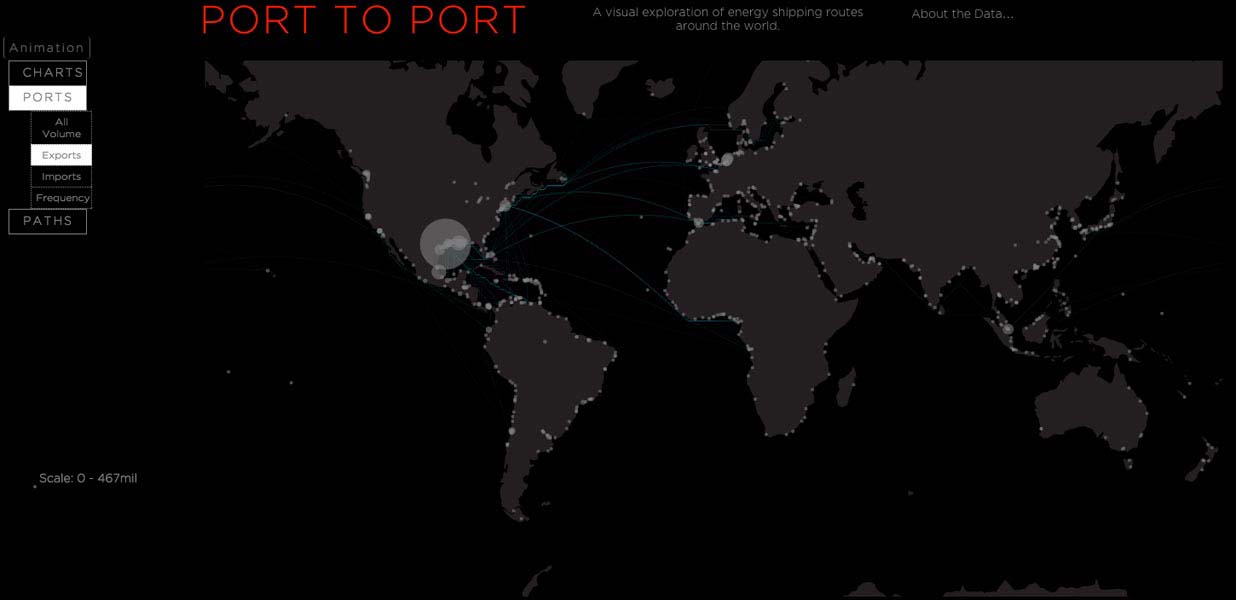
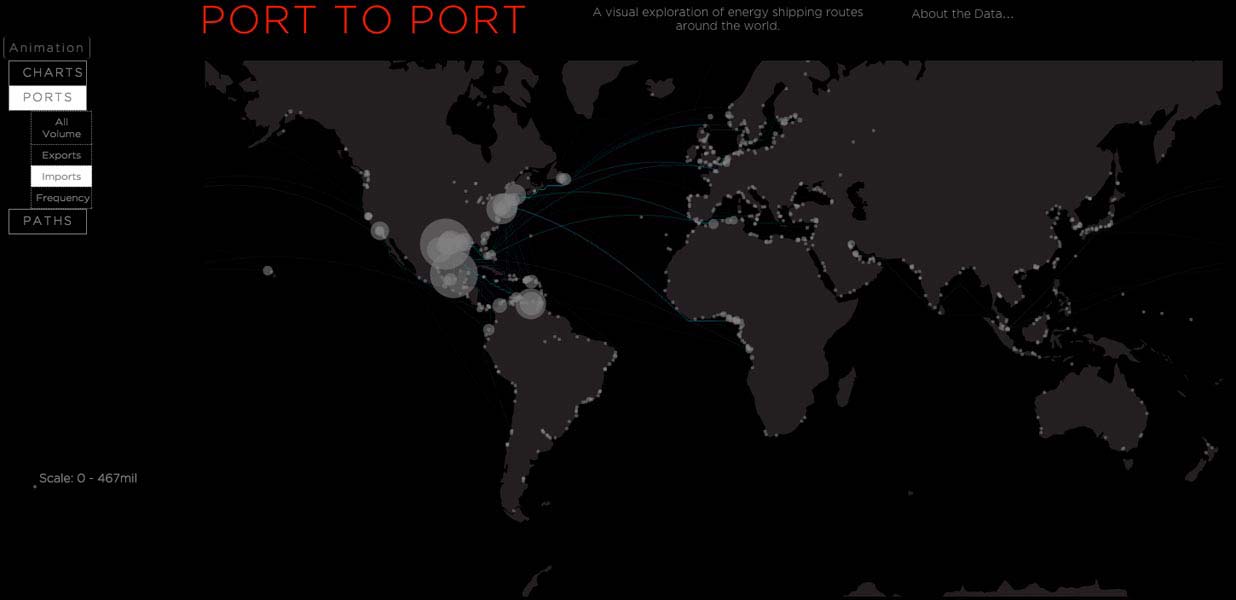
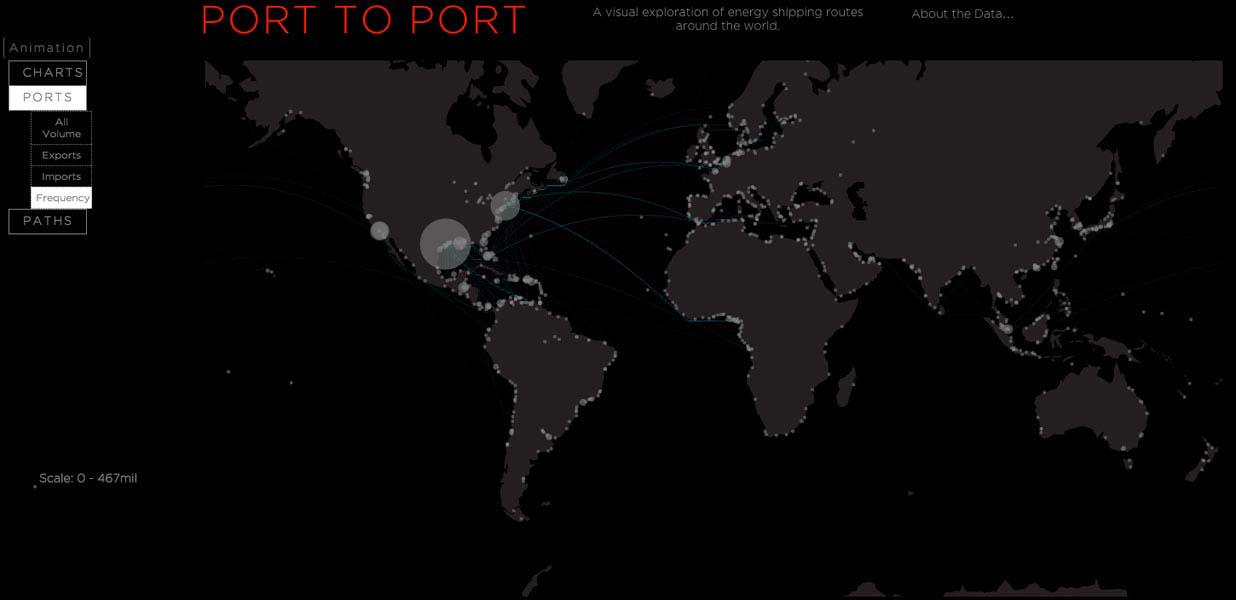
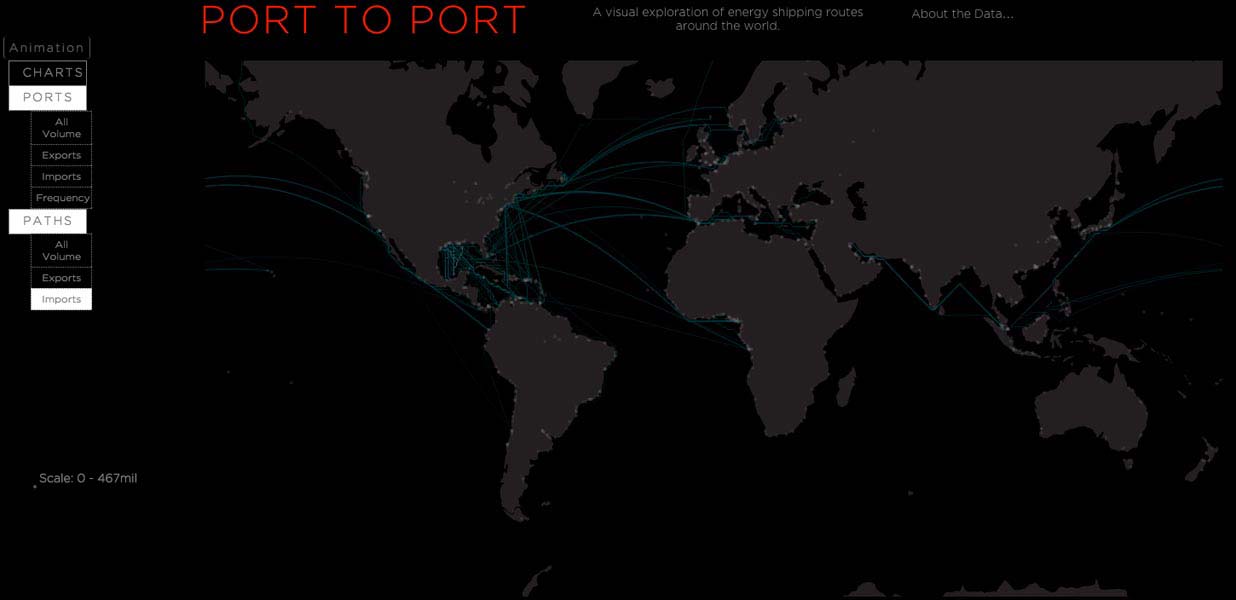
This map represents the ports and paths of the 2.7 billion Metric Tons of energy shipped through more than 90 US ports from 2002 – 2012.
These are the 200 most common energy shipping paths to and from the US.
Every port has a story. 460 million Metric Tons of oil is moved through Houston alone, connecting Houston to more than 600 ports worldwide. These shipments include the following products:
Crude Petroleum, Refined Petroleum, residual Fuel Oil, Natural Gas and Liquid Methane, Ethane, Propane, Butane, other Gas Mixtures (Derived from Petroleum), Gases (NOS), Gasoline, Jet Fuel (Naphtha and Kerosene), Motor Fuel (NOS), Kerosene, Naphtha, Medicinal Mineral Oil, Lubricating Oils, Lubricating Grease, Liquid Petroleum Mixtures, Non Liquid Petroleum (Petrolatum), Petroleum Additives.
Using data assembled by Thomson Reuters, Port to Port maps global oil shipping routes as well as other forms of energy navigating ocean territories to and from the United States.

Port to Port©Spatial Information Design Lab

Using D3 as an interactive web platform we designed a map interface that is scaled globally while embedded with local stories about energy movement from port to port. Data can be viewed across time, which reveal changes in patterns of movement as the geopolitics, price of oil, and conditions at specific ports change.
Port1Port2Port3Port4Port5Port6Port7Port8

In collaboration with Thomson Reuters Research Unit.
The visualizations here are mainly based on the PIERS dataset, which includes every single U.S. waterborne import and export.

Link to:

Port to Port database

Project director: Laura Kurgan | Data analysis and data visualization: Juan Francisco Saldarriaga | Design development and D3 interface: Annelie Berner and Scott Murray

urbanNext (December 6, 2024) Port to Port. Retrieved from https://urbannext.net/port-to-port/.
Port to Port.” urbanNext – December 6, 2024, https://urbannext.net/port-to-port/
urbanNext September 23, 2015 Port to Port., viewed December 6, 2024,<https://urbannext.net/port-to-port/>
urbanNext – Port to Port. [Internet]. [Accessed December 6, 2024]. Available from: https://urbannext.net/port-to-port/
Port to Port.” urbanNext – Accessed December 6, 2024. https://urbannext.net/port-to-port/
Port to Port.” urbanNext [Online]. Available: https://urbannext.net/port-to-port/. [Accessed: December 6, 2024]

urbanNext
urbanNext | expanding architecture to rethink cities and territories

Newsletter

Sign up to our newsletter

Search
Generic filters
Exact matches only
Search in title
Search in content
Search in excerpt
Formats
Audio&visual
Concept
Data
Essay
Forum
Lecture
Podcast
Project
Talk
Survey
Statement
Selfthink
High Density
Middle Density
Low Density
No Density

talk

essay

project

product

survey

data

all formats