Climate scientists and experts from the Intergovernmental Panel on Climate change (IPCC) agree that the reason behind global warming is the human expansion of greenhouse effects. Around 1300 scientific experts from all around the world have concluded that there is a 90% probability that human activity has warmed up the planet over the last 50 years. The recent anthropogenic emissions of greenhouse gases are the highest in history, which has led to a widespread impact on natural and human systems. The observed changes in the climate system are a warming of the atmosphere and oceans, a diminished amount of snow and ice, and sea level rise. Global ocean warming is largest near the water surface: the upper ocean (0-700 m) has warmed by 0.11°C over the period from 1971 to 2010. The warming of oceans accounts for more than 90% of energy stored in the climate system, while only 1% is stored in the atmosphere. Another observation shows high levels of precipitations over the mid-latitude land areas of the northern hemisphere. While other latitudes have low confidence for area average long-term positive or negative trends. Changes have been observed in ocean surface salinity as well: as regions with high salinity, where water evaporation is more dominant, become more saline; and regions of low salinity, where water precipitation dominates, become fresher. Since the beginning of the Industrial Revolution the ocean uptake of CO2 has caused acidification of the ocean, accounting for a 26% increase in acidity, which is equivalent to a decrease in pH of 0.1 (high confidence). Between 1992 to 2011, the Antarctic and Greenland ice sheets have been losing mass, as glaciers have been shrinking in size worldwide. Moreover, the northern hemisphere spring snow cover has decreased and is continuing to decrease. Between 1979 and 2012 the annual mean Arctic sea ice extent decreased – corresponding to a 3.5% to 4.1% decrease per decade, most rapidly in the summer season. While on the contrary, the sea ice extent increased from 1.2% to 1.8% in the Antarctic region. Finally, the global mean sea level rose by an average of 0.19 m over the period from 1901 to 2010. The main contribution to climate change is the increase of Anthropogenic greenhouse gas emissions. Gases that contribute to the green house effect include carbon dioxide, nitrous oxide, methane, and water vapor. These gases block the heat from escaping the atmosphere into space, and carbon dioxide is the main gas contributing to climate change. However, carbon dioxide is released through natural processes, such as respiration and volcano eruptions, and through human activities such as deforestation, land use changes, and burning fossil fuels.Nevertheless, human activity has increased the CO2 emissions by more than one-third since the beginning of the industrial era, driven by population and economic growth.
CO2 emissions
Carbon dioxide is a natural gas that is produced by the process of photosynthesis. It is also a byproduct of biomass burning and fossil fuel burning, as well as being emitted from industrial activity and as a result of land use changes. However, the anthropogenic carbon dioxide emissions are caused by the combustion of fossil fuels such as oil, gas and coal, and cement manufacturing. It is important to note that different fossil fuels produce different amounts of carbon dioxide: for example, oil releases 50% more carbon dioxide than natural gas, while coal releases twice the amount. Also, cement manufacturing produces half a metric ton of CO2 for each metric ton of cement produced. The data used in the graph includes the gases from burning fossil fuels and cement manufacturing; however, it excludes emissions from land use like deforestation.
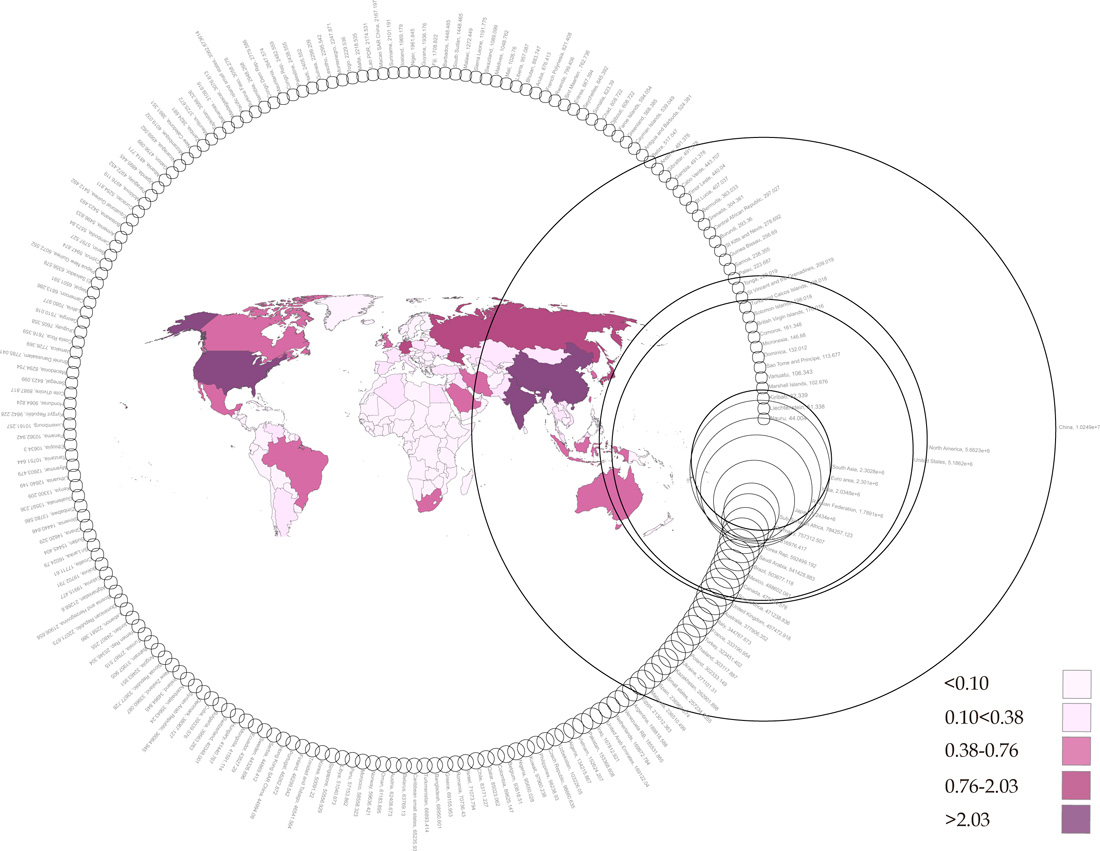
Since the beginning of the industrial era, massive amounts of greenhouse gases have increased the concentrations of carbon dioxide, methane, and nitrous oxide in the atmosphere. Over the period from 1750 to 2011 the cumulative anthropogenic carbon dioxide emissions into the atmosphere amounted to around 2040 Gt Co2. 40% of these emissions remained in the atmosphere and 30% were absorbed by the ocean. Half of the CO2 emissions for that perid occurred in the last 40 years. The graph below shows the CO2 emissions in Kt for all the countries in the world. The four areas with the highest CO2 emission levels are recorded as China with 10,000,000 kt, North America 5,600,000 kt, United States 5,100,000 kt, and finally South Asia 2,000,000 kt.
The burning of carbon-based fuels has increased the CO2 emissions in the atmosphere, causing anthropogenic climate change and a rapid increase in the rate of global warming. The CO2 causes ocean acidification because CO2 dissolves in water and forms carbonic acid, which harms the ecosystem of the ocean. Also, these gases disturb the Earth’s radiative balance, which increases the Earth’s surface temperature, leading directly to sea level rise and disturbing global agriculture.
 Global mean sea level and Thermal expansion
The Anthropogenic GHG emissions are affected by population, economic activity, lifestyle, land use patterns, energy use, technology and climate policy. These graphs show the representative concentration pathways (RCPs) used to make projections based on the previous factors mentioned. These graphs show how global mean sea level and thermal expansion are varying according to the GHG emissions. The RCPs include one stringent mitigation scenario (RCP 2.6), two intermediate scenarios (RCP 4.5 and RCP 6.0), and one scenario with very high GHG emissions (RCP 8.5). All these scenarios are studied until the year 2100 (IPC, 2014).
It is very clear that global mean sea level and thermal expansion have a directly proportional relationship, where if one rises the other rises as well. For example, the RCP 2.6 scenario, which aims to keep global temperature below 2°C above pre-industrial temperatures, indicates that the global mean sea level rise would see a rise of 0.6 m. The worst-case scenario, which considers no carbon dioxide emissions cuts at all, records a 1.0 m rise in the year 2100.
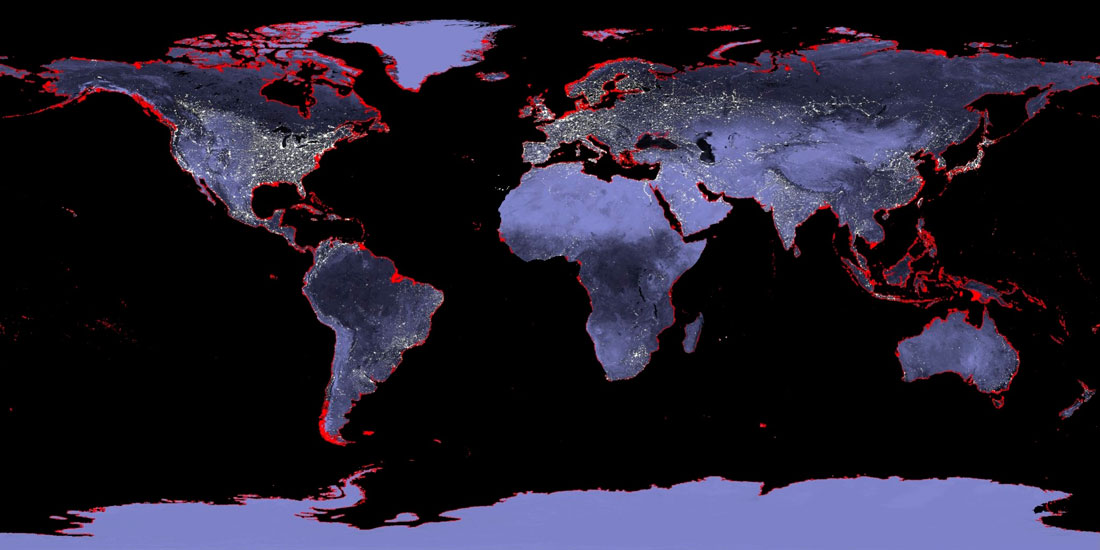
“One potential climate tipping point is the response of sea level to changes in the Greenland and Antarctic ice sheets. Melting of the ice sheets adds liquid water to the oceans and raises global sea level. Although researchers are working to develop numerical models that will narrow down exactly how fast and how much the ice will melt, development of these models may take more than a decade. This image shows in red areas that would experience flooding due to a one-meter rise in sea level, which is not significantly beyond the range that many scientists expect could happen by the end of this century.”
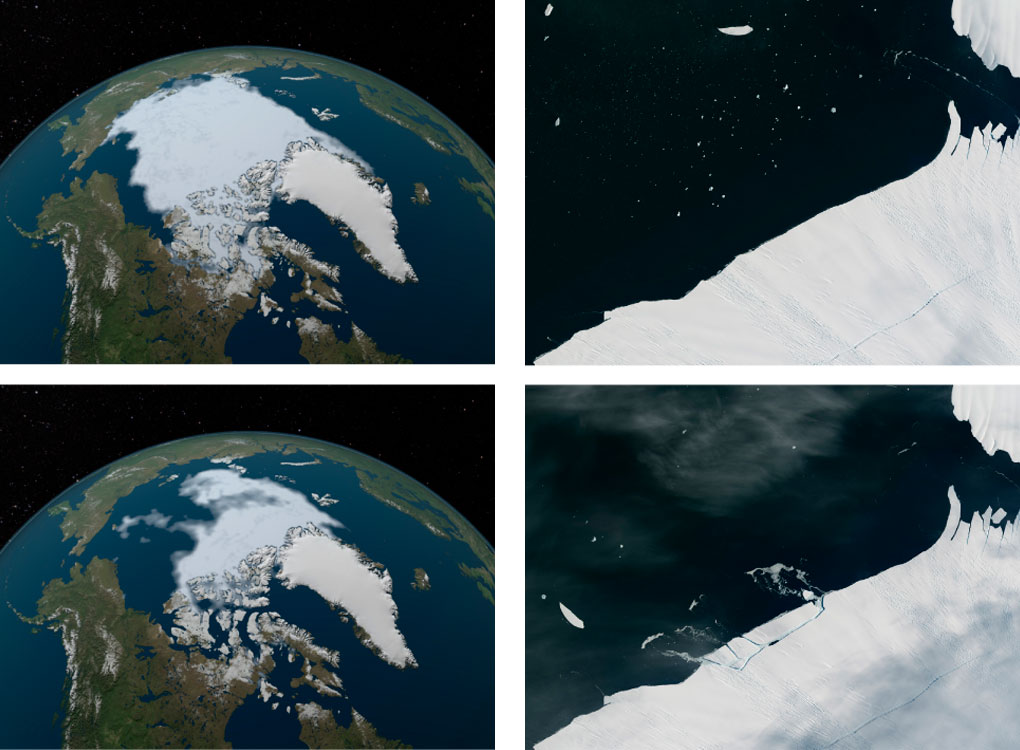
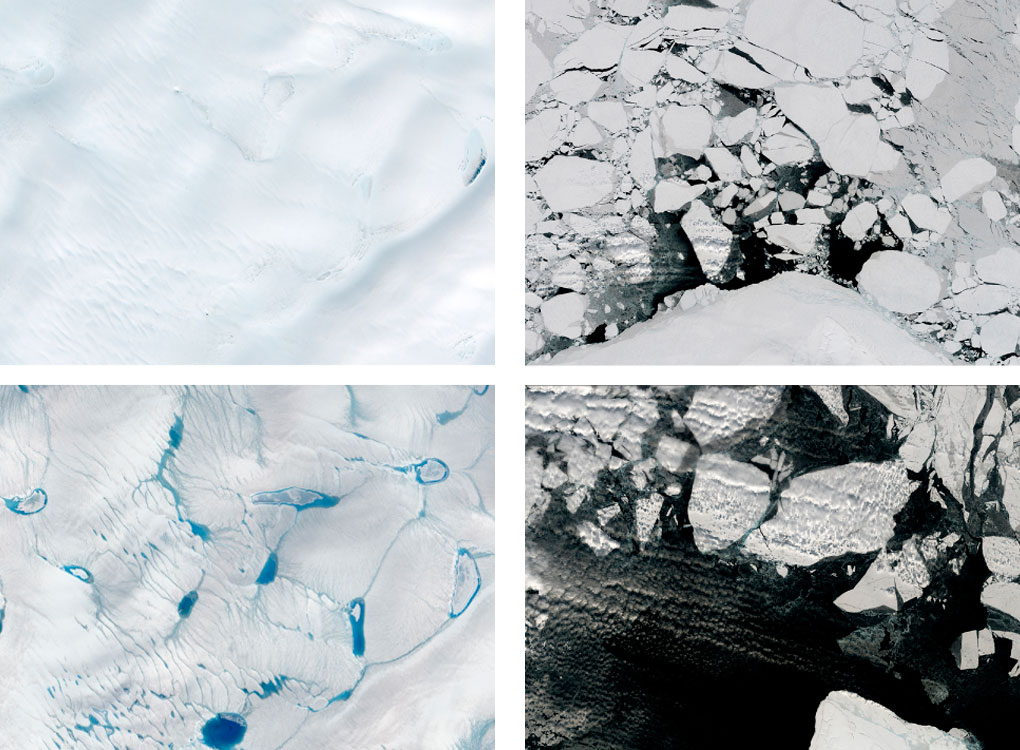
(left) The lowest ice cover in the Arctic Ocean is in September. The ice shrinks during summer and increasing during winter. However in comparison with minimum ice coverage in 1984 which was almost equal to the average minimum for 1979-2000 with that of 2012 when the minimum was about half. The minimum rate in 2016 was the second lowest record at the rate of decline. NASA scientist Joey Comiso, “it’s very likely that the Arctic’s summer sea ice will completely disappear within this century
(right) A block of ice roughly one to two Km long has broken off Antarctica’s Pine Island Glacier. The glacier is estimated to deliver around 79 cubic Km of ice into the adjacent bay. This ice will move from the West Antarctic to the ocean contributing to sea level rise.
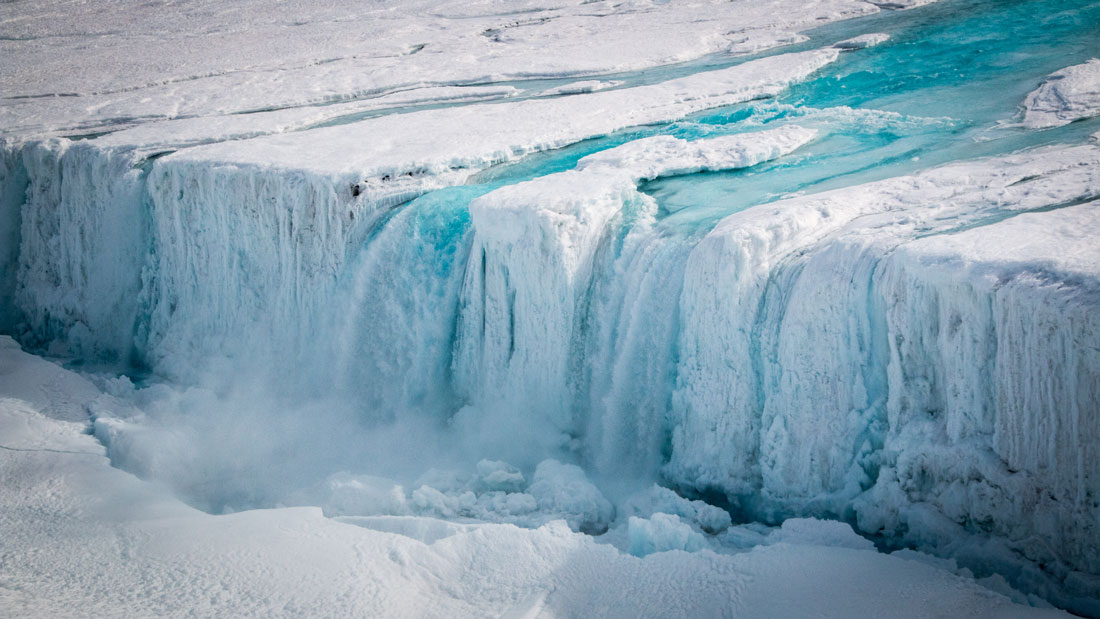
(left) Melting of Greenland Ice sheet began exceptionally early in 2016. Melting causes further melting when ponds of meltwater form because they darken the surface and absorb more sunlight than ice. When water runs into the ocean if flows through crevasses which helps in speeding up the ice flow and contibute to sea level rise.
(right) In mid April 2016, the sea ice in Beaufor Sea suffered signficant breakup and fracturing; earlier than the it usually happens. This change is attributed to the unusall warm air tempretures during the first months of the year that causes strong winds to have high pressure system over the area.


