Certainty is on the tip of every climate activist, scholar and writer’s tongue these days. We are certain we have only until 2030 to rapidly decarbonize the economy. We are certain that even if we do manage to meet this ambitious goal, sea levels will still rise another foot or so, demanding that our cities do the same, or that their people be relocated, away from our shifting shoreline. We are certain things are getting worse – convinced, even, that they are somehow worse than we’ve imagined.
Average Annual Temperature Increases
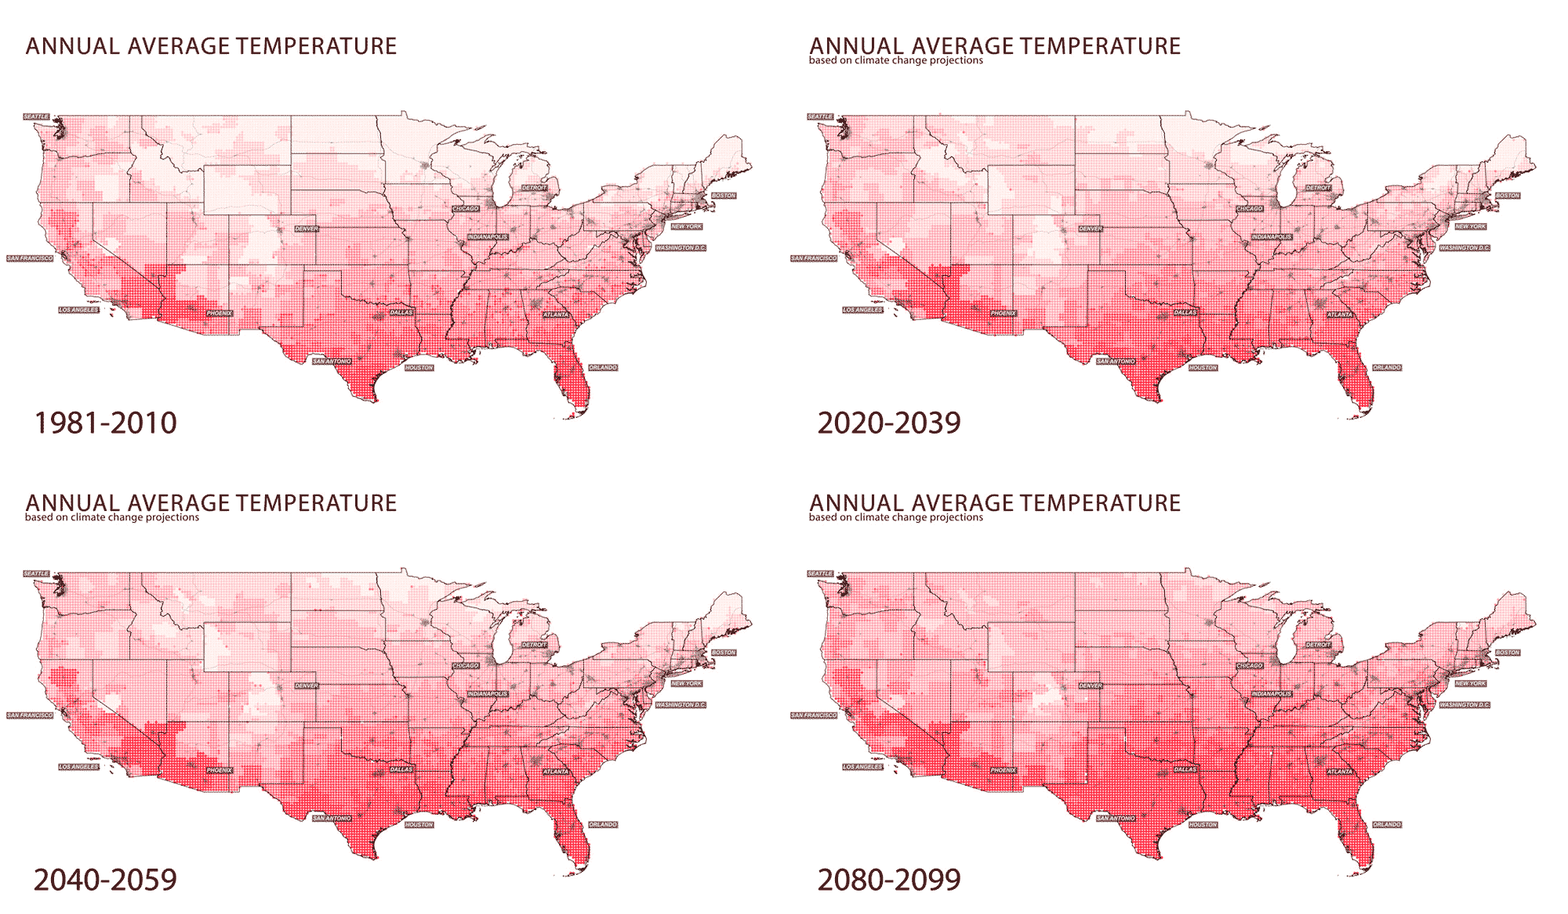
By the end of 21st century, the temperature will have increased an average of 9.3 degrees Fahrenheit. The annual average temperature in the Northwest of the US will reach 75.3 Fahrenheit, with an average 16% increase.[1] The average annual temperature of Texas 1981-2010 was 65 degrees, with a summer average of 82 degrees and a winter average of 48 degrees. According to projected temperatures for 2080-2099, the average annual temperature will be 74 degrees with a summer average of 90 degrees and a winter average of 56 degrees. Minnesota’s 1981-2010 annual average was 42 degrees, with a summer annual average of 67 degrees and a winter annual average of 13 degrees. In the 2080-2099 period, the temperatures are projected to be 53 degrees annually, 78 degrees in the summer and 25 degrees in the winter. The northern states face the highest average annual change, with Minnesota, North Dakota, and Wisconsin seeing an increase of 11 degrees. The West Coast and Gulf Coast will see the least change, still a staggering change of 6 degrees for Florida with the rest of the coasts at 8 degrees.[2]
Economic Effects of Climate Change
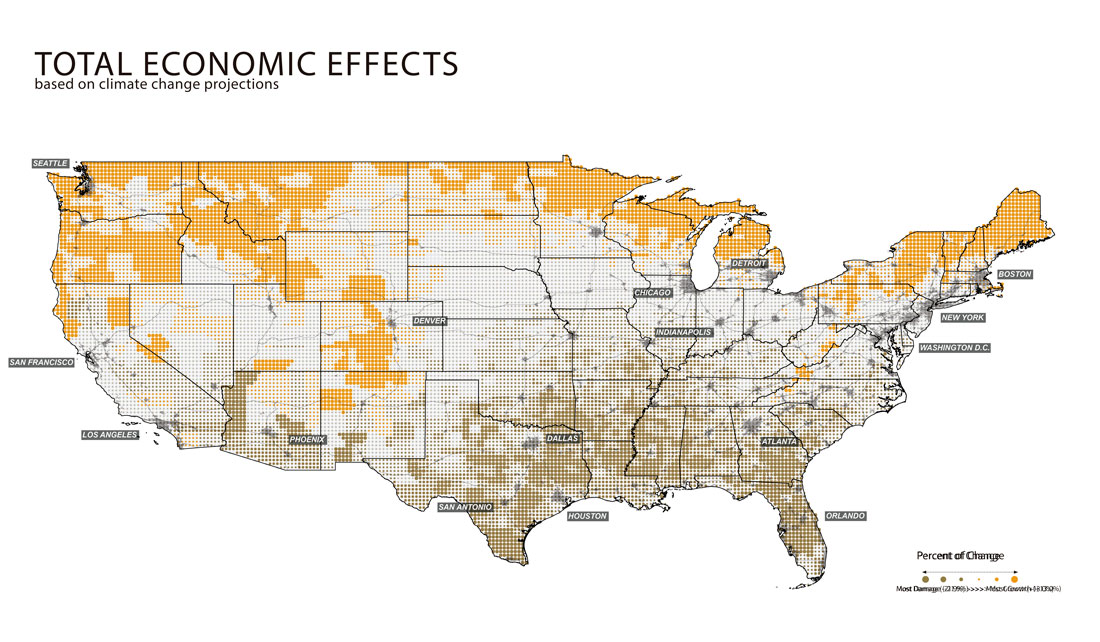
While the GDP is a less than ideal way of measuring overall economic health, there is no better way of measuring. By the 2080-2099 period, more than 76% of counties in the US will be suffering from economic damage due to climate change, while 24% of counties will experience economic benefits when compared to the 1981-2010 averages. Economic damage is considered as the combined value of market and non-market damage across the agriculture, crime, coastal storms, energy, human mortality and labor sectors, and it varies from -20% to 20% (with damages smaller than 0% indicating economic benefit).[3] The losses are largest in the regions that are already poorer on average (Southern, Central, and Mid-Atlantic), increasing inequality as value transfers to the Pacific Northwest, Great Lakes Region and New England.
Agriculture and Climate Change
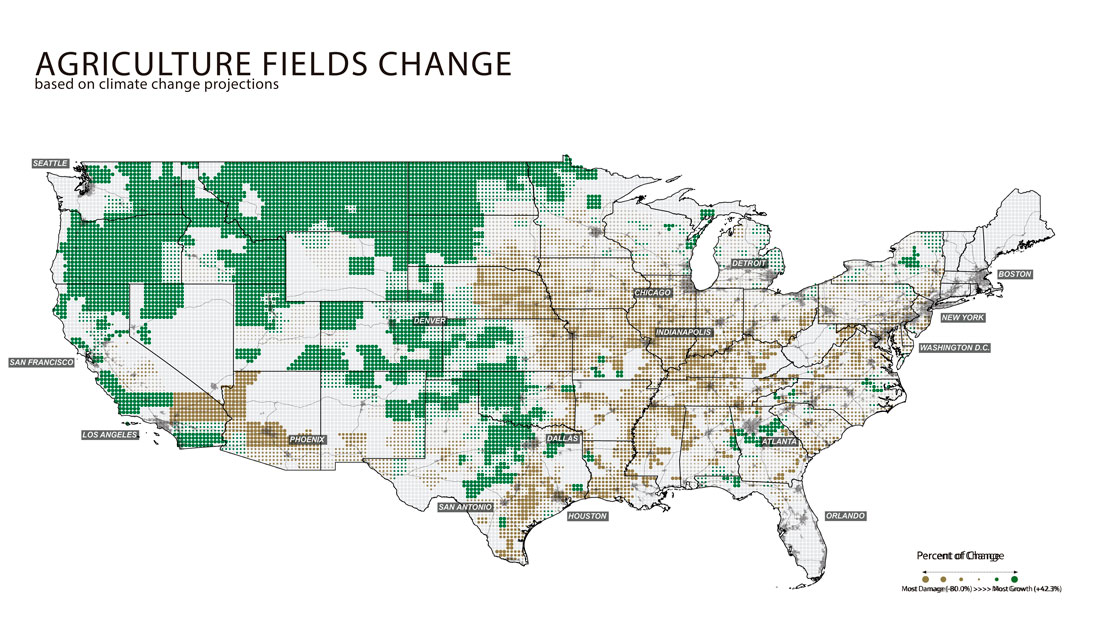
Accounting for estimated effects of CO2 fertilization and precipitation, national yields will be reduced 9.1% to 12.1% per degree Celsius increase in global mean surface temperature.[4] These calculations account for percent change in area-weighted yields for corn, wheat, soybeans and cotton. The Midwest and Southern California, where most agriculture takes place, will see a decrease of at least 50% of yields. The North and West of the country, from the Dakotas to Northern California, will see an increase of 45%.[5]
Energy Demand and Climate Change
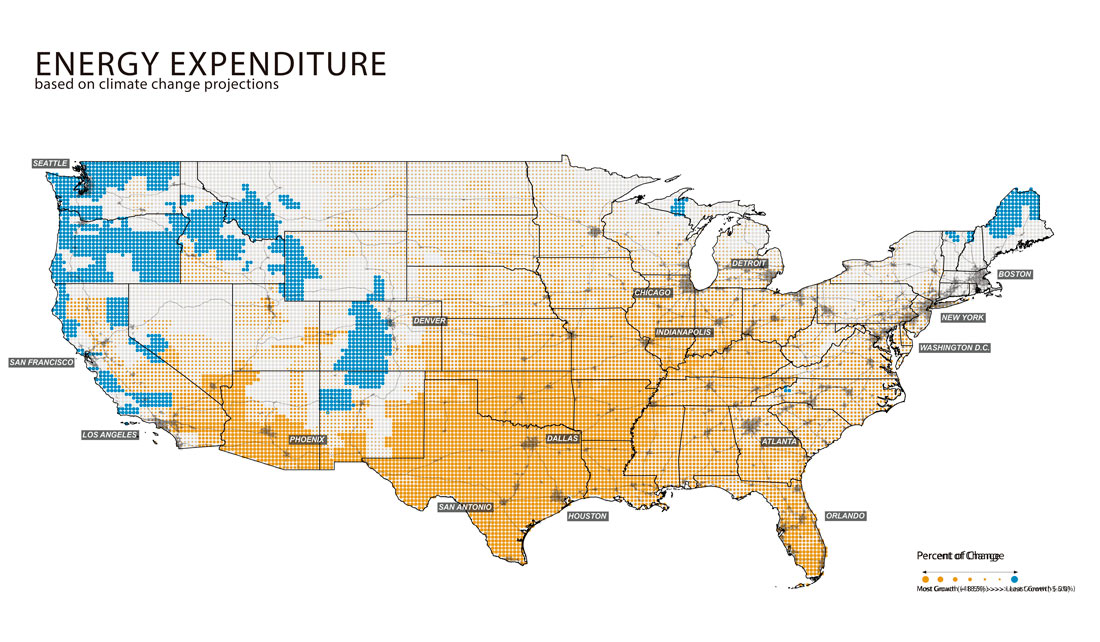
For every degree Celsius that the global mean surface temperature rises, electricity demand will rise roughly 5.3%. Rising demand from hot days will more than offset falling demand from cool days.[6] This trend can be seen most in the South, particularly in Texas, where the increasing annual temperatures will result in a 20% increase in energy use. While nearly the entirety of the US will increase its expenditure, areas of the Cascadia, Northern California, Southern California and Front Range megaregions, as well as northern Maine, will decrease their energy expenditure – possibly due to an increase of efficiency, decrease of cost and warmer winters.
Mortality Rates and Climate Change
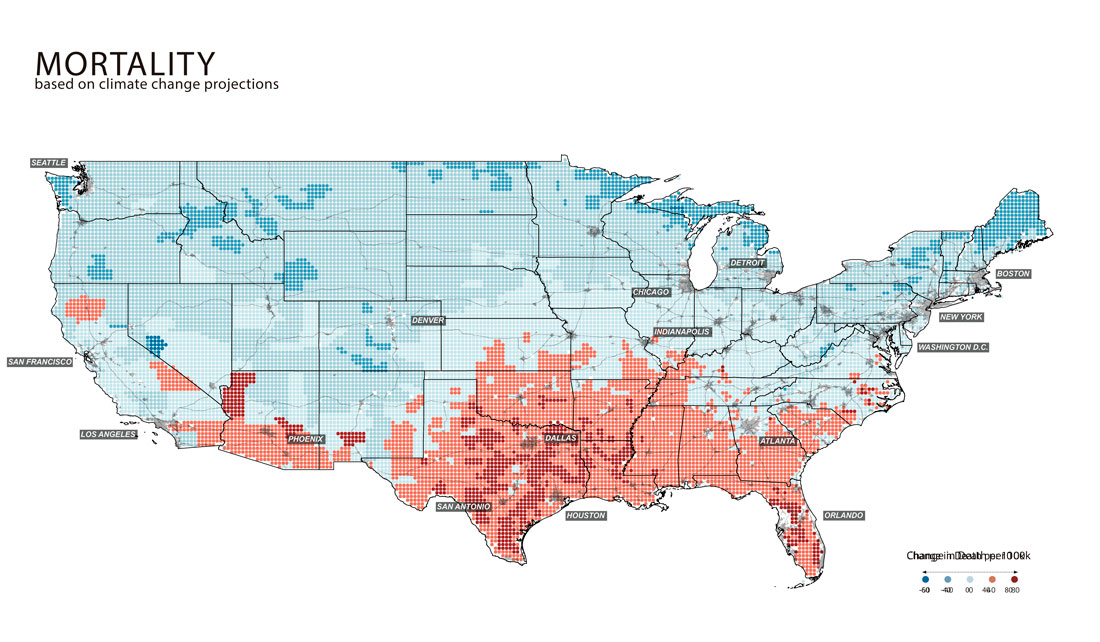
This map shows the change in all-cause mortality per 100k across all age groups.[7] Due to the increasing temperatures nationally, the number of heat-related deaths in the south is projected to increase and the number of cold-related deaths in the north is projected to decrease.
Labor and Climate Change
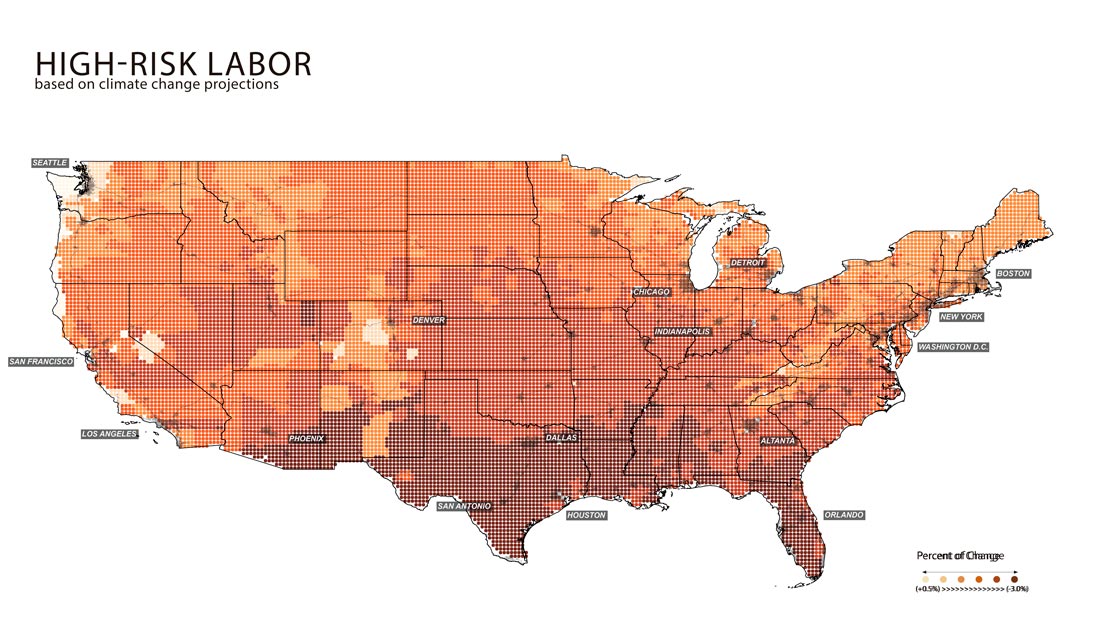
Due to climbing temperatures, there will be an increased risk for workers exposed to outdoor temperatures. This map shows the change in labor supply of full-time-equivalent workers for high-risk jobs, showing the distribution across the US. Following the temperature gradient, Texas and the Gulf Coast states will have the highest increase in unsafe exposure at 3%, though the entirety of the continent, except for pockets in Washington, California and Colorado, will see an overall increase in risk.[8]
Coastal Economies and Climate Change
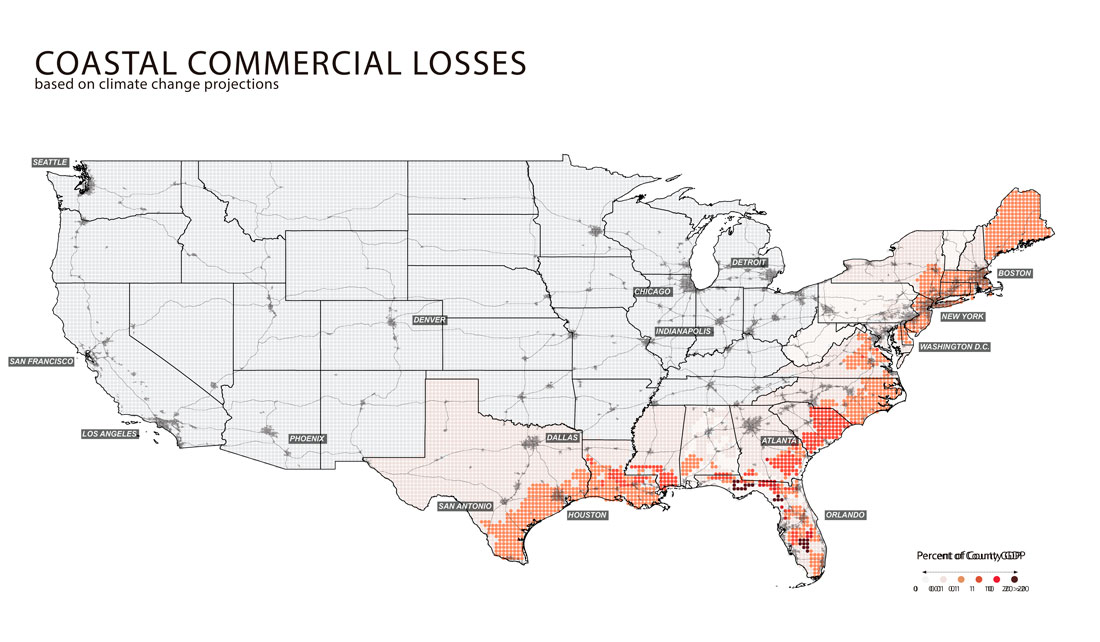
This map illustrates the levels of risk sea level rise poses along Southeast coastlines, taking into consideration the susceptibility to change and adaptation measures. The Coastal Vulnerability Index used here is based on tidal range, wave height, coastal slope, shoreline change, landform and processes, and historical rate of relative sea level rise.[9]
Sea Level Rise and Displacement
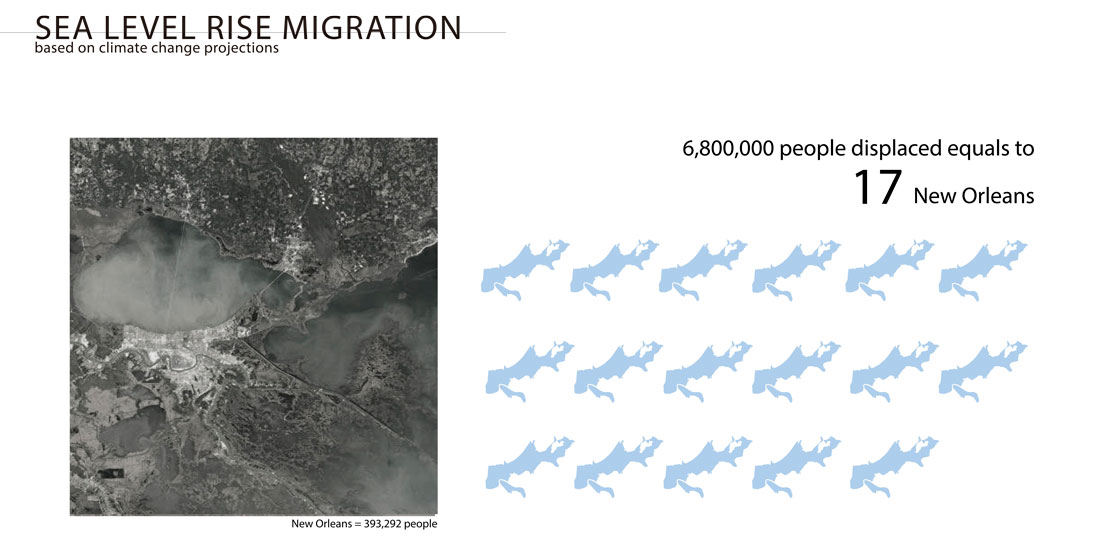
The population of the sea level rise migration in the US would equal 10 times the Katrina migration numbers.
