Skip to content

Audio Version

See more about

More info

The Big Data Model

Data Form weaves together a set of mixed-use islands within a matrix of internal commercial connectedness. The mixed-use building—a self-segregated city within a city—is so unique and irresistible that it effortlessly attracts inhabitants into a limbo of shared distraction. It engenders a field of numbness characterized by its appealing adequacy and its uncritical relevance, which hides the extreme vulnerability of the user under the illusion of his/her overpowering by sheer consumption.

Data Form is an entangled archipelago of islands characterized by determined indeterminacy, uprising their machinery for generating totally unnecessary information by means of an internal web that frantically produces difference for the sake of difference. A manifold of mixed-use buildings acts as the infrastructural spine that integrates independent commercial masses within a single artifact. The more congested this spine, the more numerous its internal connections, the more open the exchanges, and the more indifferent to the outside world.

A set of common behavioral rules relates programs across a set of mixed-use buildings, in the attempt to foster programmatic coexistences and induce them to transform each other. The rules result from the quantification of variables across a mixed-use taxonomy, the recognition of patterns across those variables, the construction of internally consistent behaviors, and the configuration of relations that work as gradients in an informational continuum. This manifold of mutual destabilizers paradoxically constructs a highly static universe, the vibrating programmatic heterogeneity of which is dispersed to the point of becoming a rigorous, indeterminate order. Variables are organized by the unfolding of cores within a set of mixed-use buildings, arranged as a sequential logic of number of programs per core. Various levels of complexity are achieved based on the following variables: total surface area per core, total surface area per program per core, average floor area per program, spatial height per program, plan depth per program, distance of programs to the ground, surface area of core per program, surface area of hallway per program, and vertical and horizontal connectivity between programs. The gradient of organizational diversity that emerges from the mixed-use mix is conditioned by the intertwinement of variations, and a series of mixed-use manifolds is constructed through the integration of this web.

The accumulation of these incompatible spatial conditions configures a mountain of mutually displaced pyramidal sections with interstitial plateaus that build up a single cumulative structure. The blunt reification of information creates the basis for the rugged megaform, which both systemically and allegorically piles up the informational debris indexed along its generation. The pyramidal sections of this pile configure a manifold of pinnacles. Consumption reaches its maximum density in the central, highest point, which radiates the internal logic outward, reaching its ultimate amplification when the interior releases its containment and projects itself as a singular totality.

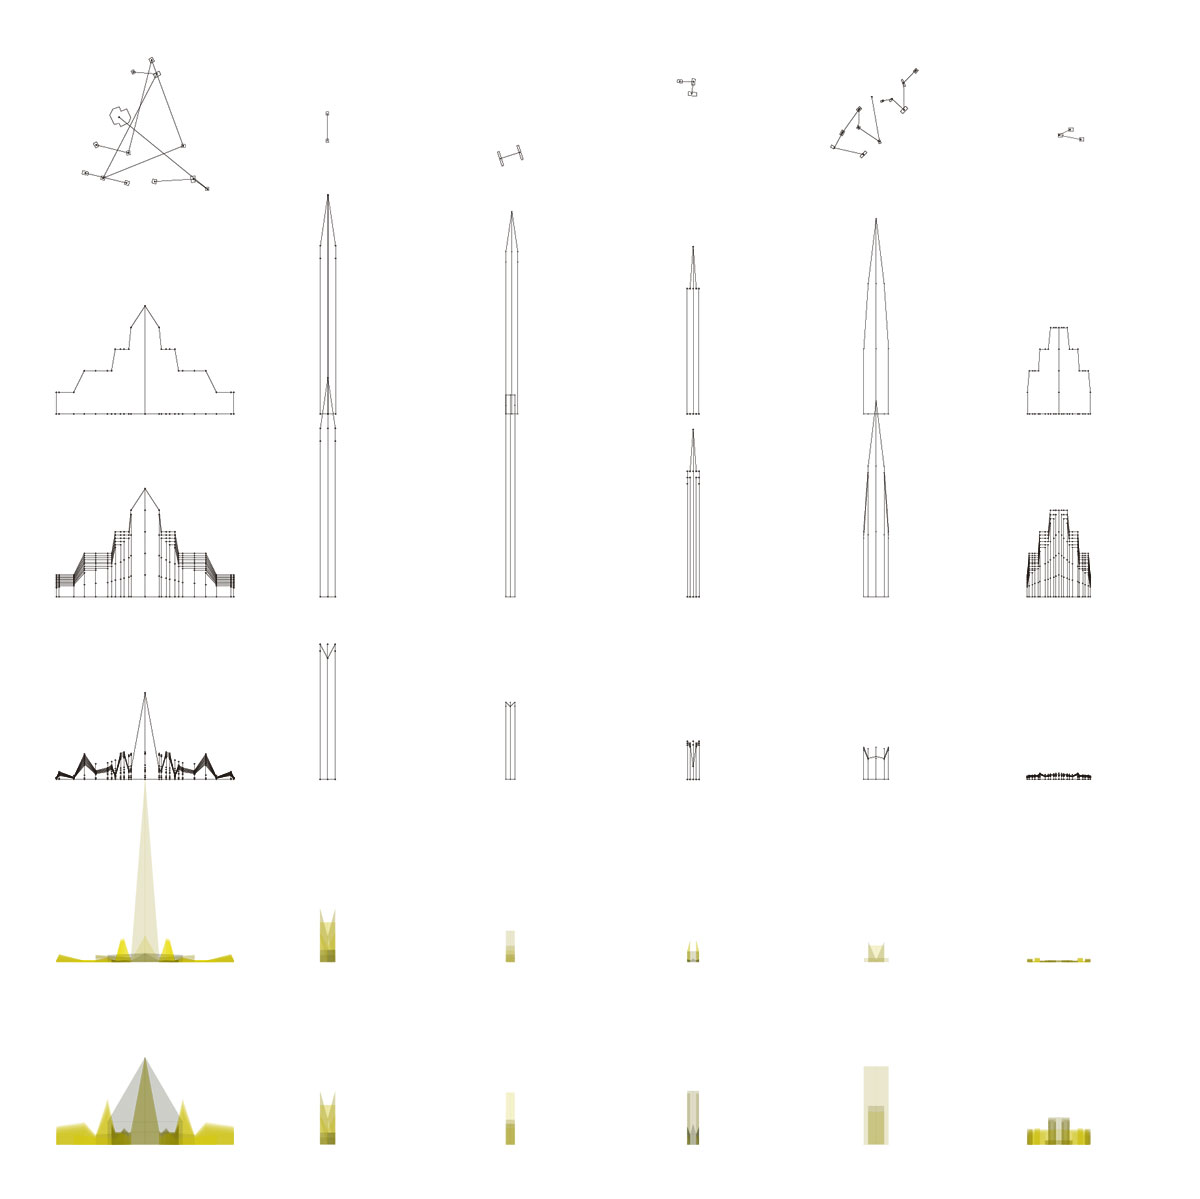
Typology. Abstraction. Mixed-use vertical programmatic distribution. From top to bottom: relative programmatic distribution, absolute programmatic distribution, programmatic distribution by height and area, programmatic distribution in elevation, programmatic overlay in elevation, programmatic plug-ins along vertical spines.
From left to right: Minoru Mori, Roppongi Hills, Tokyo, Japan; Skidmore, Owings & Merrill, Time Warner Center, New York, NY, USA; Jean Nouvel, Tour Signal, Esplanade de la Defense, Paris, France; REX, Museum Plaza, Louisville, KY, USA; Steven Holl, Vanke Center, Shenzhen, China; Herzog & de Meuron, 1111 Lincoln Road, Miami, FL, USA. Elevation charts.
Typology. Abstraction. Mixed-use vertical programmatic distribution. From top to bottom: scaling of core spine, programmatic reorganization, programmatic distribution per core, introduction of horizontal circulatory components, recognition of inner voids, unfolding of slabs.
From left to right: Minoru Mori, Roppongi Hills, Tokyo, Japan; Skidmore, Owings & Merrill, Time Warner Center, New York, NY, USA; Jean Nouvel, Tour Signal, Esplanade de la Defense, Paris, France; REX, Museum Plaza, Louisville, KY, USA; Steven Holl, Vanke Center, Shenzhen, China; Herzog & de Meuron, 1111 Lincoln Road, Miami, FL, USA. Elevation charts.
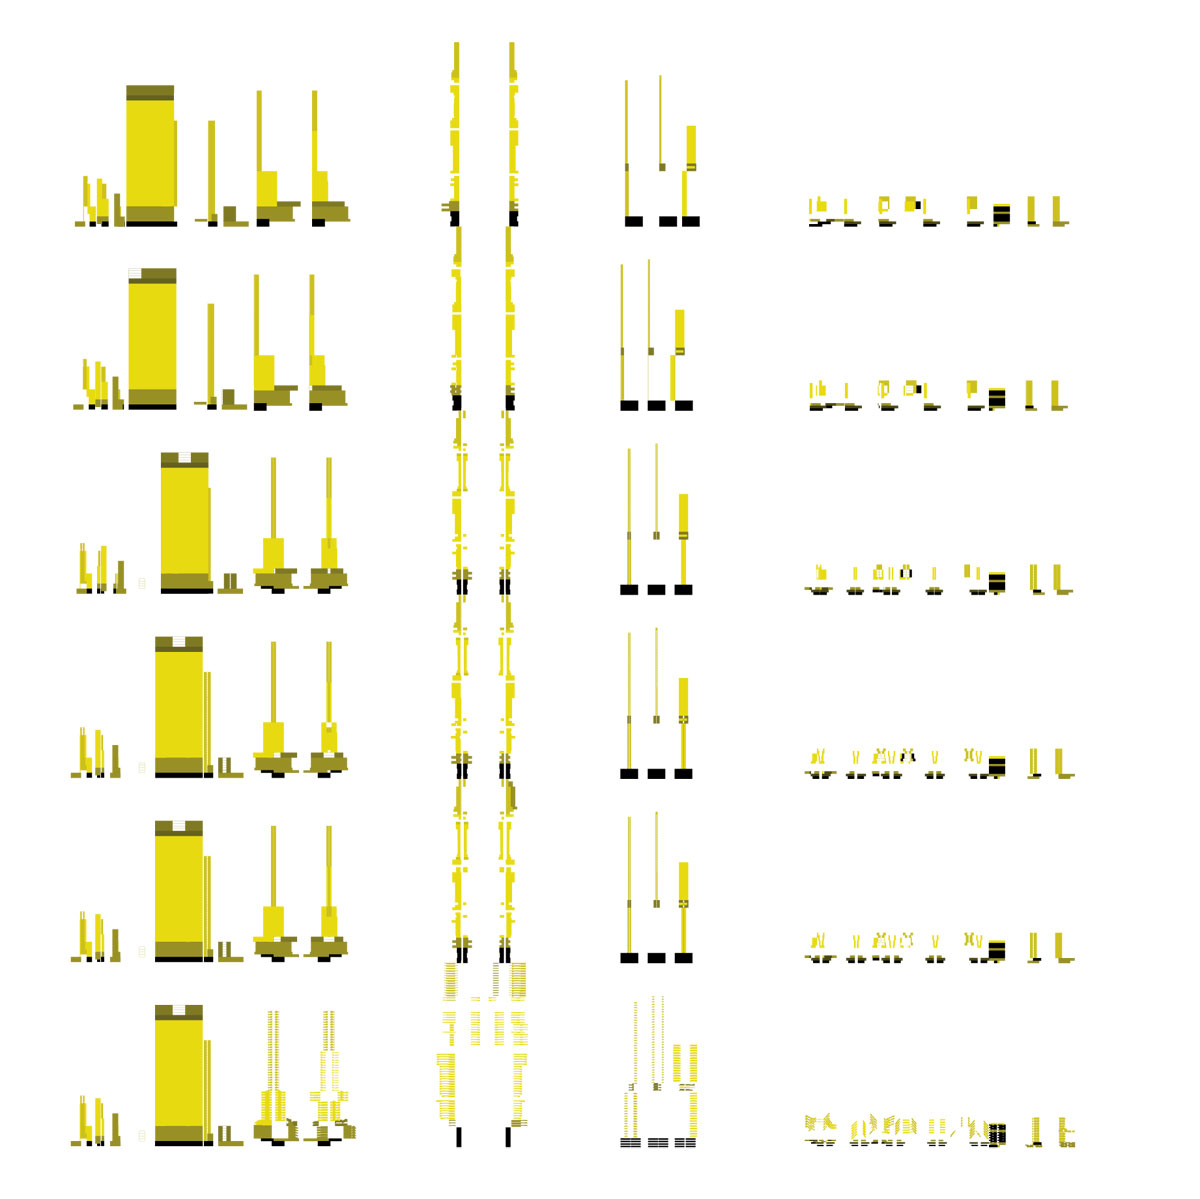
Modality. Evaluation. Mixed-use relative variation of programmatic areas. From top to bottom: core sequence by proximity, plan unfolding, number of programs per core, total surface area per core, total surface area per program per core, average floor surface area per program.
From left to right: Minoru Mori, Roppongi Hills, Tokyo, Japan; Skidmore, Owings & Merrill, Time Warner Center, New York, NY, USA; Jean Nouvel, Tour Signal, Esplanade de la Defense, Paris, France; REX, Museum Plaza, Louisville, KY, USA; Steven Holl, Vanke Center, Shenzhen, China; Herzog & de Meuron, 1111 Lincoln Road, Miami, FL, USA. Elevation charts.
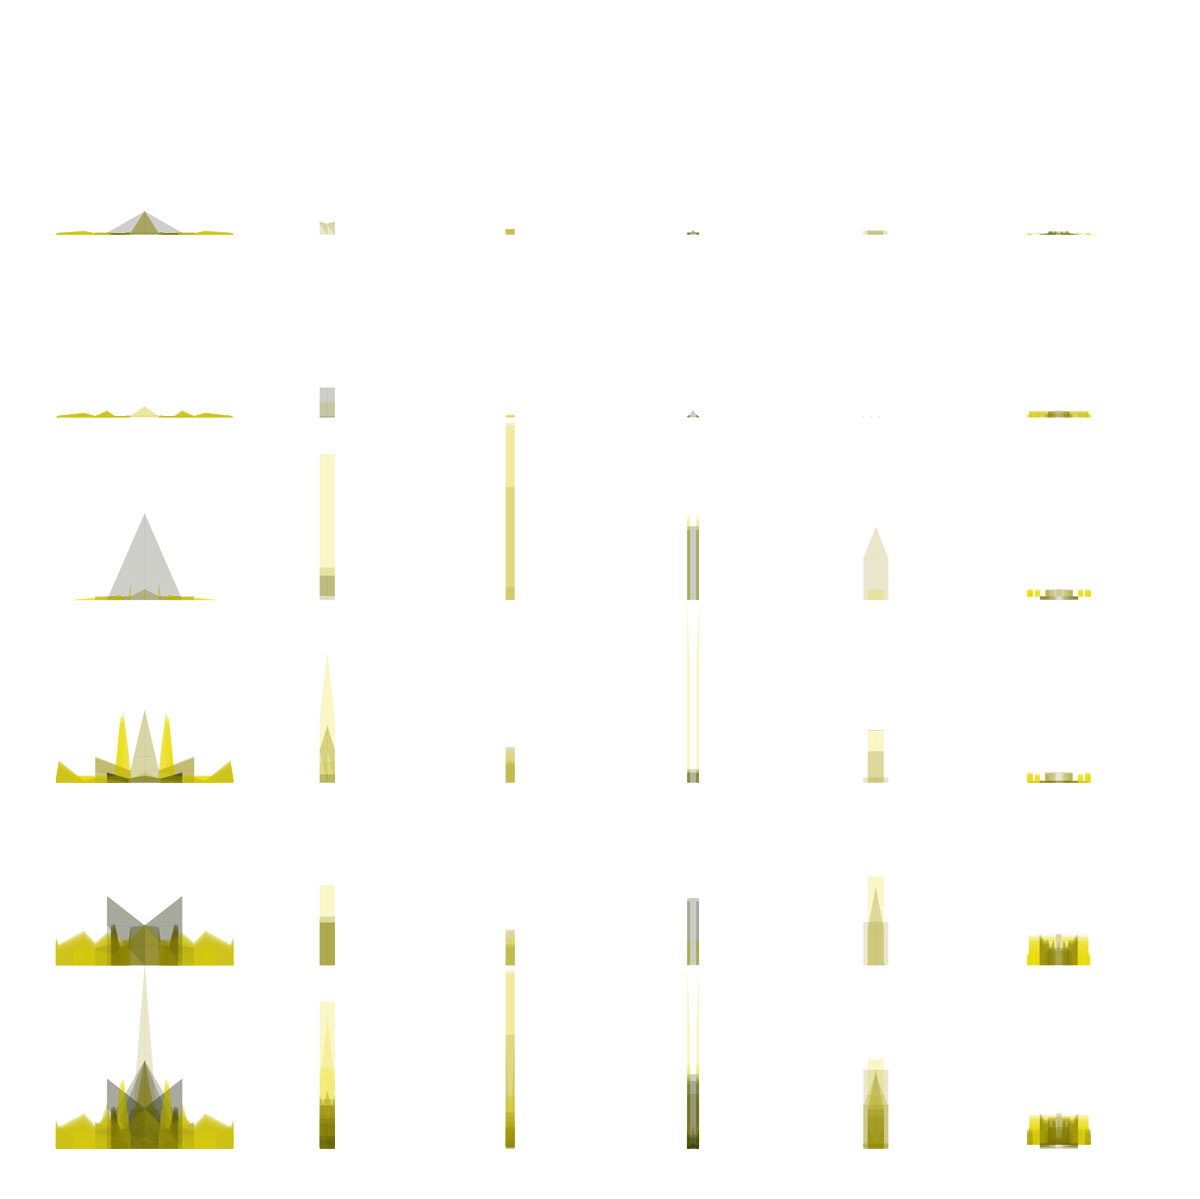
Modality. Evaluation. Mixed-use relative variation of programmatic areas. From top to bottom: floor area of core per program, floor area of hallway per program, elevation from ground per program, vertical depth variation per program, horizontal depth variation per program, composite of variations.
From left to right: Minoru Mori, Roppongi Hills, Tokyo, Japan; Skidmore, Owings & Merrill, Time Warner Center, New York, NY, USA; Jean Nouvel, Tour Signal, Esplanade de la Defense, Paris, France; REX, Museum Plaza, Louisville, KY, USA; Steven Holl, Vanke Center, Shenzhen, China; Herzog & de Meuron, 1111 Lincoln Road, Miami, FL, USA. Elevation charts.

urbanNext (December 21, 2024) The Big Data Model. Retrieved from https://urbannext.net/the-big-data-model-2/.
The Big Data Model.” urbanNext – December 21, 2024, https://urbannext.net/the-big-data-model-2/
urbanNext November 22, 2021 The Big Data Model., viewed December 21, 2024,<https://urbannext.net/the-big-data-model-2/>
urbanNext – The Big Data Model. [Internet]. [Accessed December 21, 2024]. Available from: https://urbannext.net/the-big-data-model-2/
The Big Data Model.” urbanNext – Accessed December 21, 2024. https://urbannext.net/the-big-data-model-2/
The Big Data Model.” urbanNext [Online]. Available: https://urbannext.net/the-big-data-model-2/. [Accessed: December 21, 2024]

urbanNext
urbanNext | expanding architecture to rethink cities and territories

Newsletter

Sign up to our newsletter

Search
Generic filters
Exact matches only
Search in title
Search in content
Search in excerpt
Formats
Audio&visual
Concept
Data
Essay
Forum
Lecture
Podcast
Project
Talk
Survey
Statement
Selfthink
High Density
Middle Density
Low Density
No Density

talk

essay

project

product

survey

data

all formats