


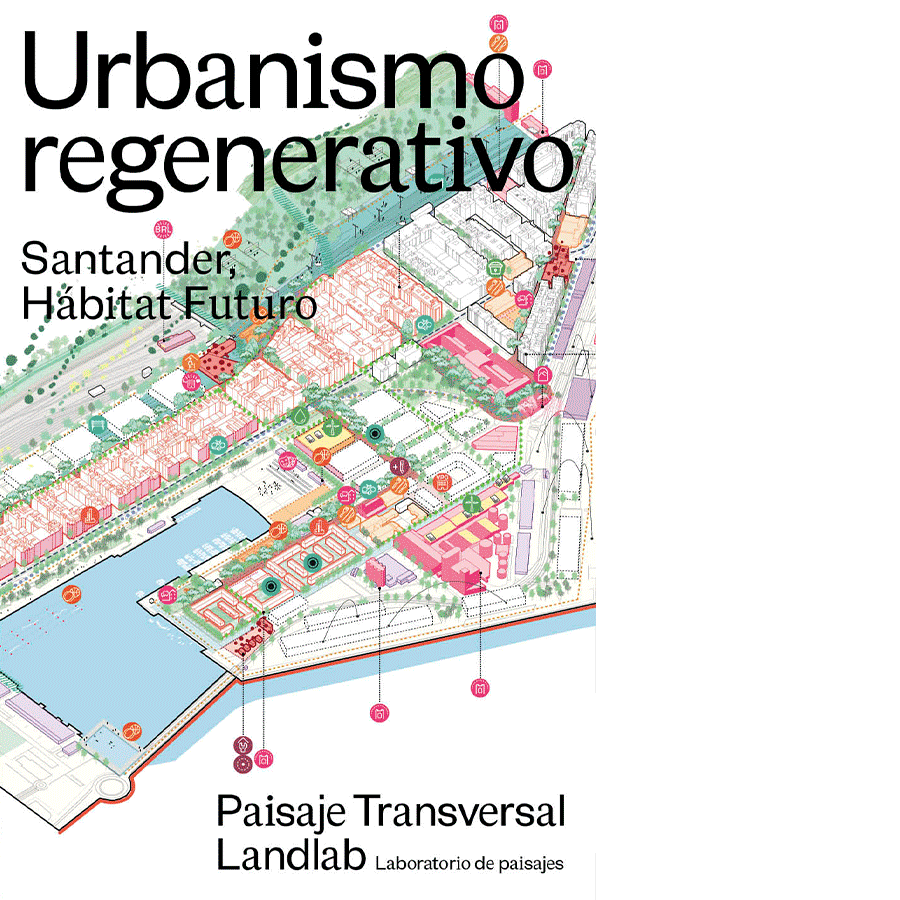
Regenerative urbanism proposes a City Model in which Santander’s adaptation to future challenges is carried out through a structure of four strategies, visualized through six major interventions defined in transversal projects, and executed in an articulated manner in each neighborhood.

The strategic plan presented below enables the identification, development, and integration of plans and projects at both city and neighborhood scales, outlining the four necessary strategies to promote their synergies. It is an open and flexible document, going beyond what we currently know as an urban plan, and serves as a roadmap to direct the commitment of various social, economic, and political agents toward the common goal of achieving a circular, sustainable, resilient, integrated, prosperous, vital, and inclusive city.
- Santander, vital and inclusive
- Santander, integrated and connected
- Santander, active and prosperous
- Santander, sustainable and resilient
————————————————————————————————————————————————————————————————————————————–
Strategy 1: Santander, vital and inclusive
Santander, vital and inclusive, is a strategy that designs and establishes the “15-minute city” for all neighborhoods, an urban planning paradigm recognized and demanded by the citizens of this city. This model ensures that all daily needs are met within a walking or biking distance. It is a human-scale city, welcoming to everyone, with all services and activities connected by a network of civic axes, sustainable transportation, and natural routes that directly influence the quality of life.
Strategie 1 Scheme
Santander then transforms into a proximity city, a city of neighborhoods. To achieve this, the neighborhood units that make up the municipality are defined, and the necessary actions are proposed to complete their urban functionality, considering the diversity of their fabrics and inhabitants.
This strategy proposes interventions for residential and facility consolidation and regeneration, complemented by a set of detailed proposals that intersect transversally with the other three strategies of the Santander, Future Habitat model, forming an essential set to ensure vitality and inclusion in each neighborhood.
Understanding the Bioregion

Santander Bioregion Plan
Regarding population and residential dynamics, the metropolitan area of Santander consists of 17 municipalities that show undeniable interdependence based on the following data.
The population of the municipality of Santander—the capital and main city of Cantabria—historically and gradually increased until it reached 191,079 inhabitants in 1991. Since then, over the last 30 years, its population has gradually declined to 171,951 inhabitants (2017) and has slightly recovered in the last five years to 172,221 inhabitants (2021). During the same period, the population of its metropolitan area, Cantabria, and the entire country increased continuously, with exceptional growth during the real estate bubble (up to 1.5-2% annually), except for the period from 2013-2016 due to the crisis, according to data from the National Institute of Statistics (INE).

Population flux through 2020 (Data from ICANE)
To understand these paradoxical trends, one must analyze the population transfer to the surrounding municipalities (see lower graph). While Santander lost 18,858 inhabitants during this period, the 16 municipalities in its metropolitan area gained 56,021 registered people, resulting in a total positive balance for the metropolitan area of 37,163 inhabitants, an increase of more than 1,000 people per year.
As in any metropolitan area, the dynamics of the Santander Bay are not limited to the administrative borders of the municipalities. As observed, there is a process of attracting residents from the dense, consolidated, and sometimes congested urban core to the new suburban periphery for usual reasons: connection with natural space, larger housing, new construction, and lower prices. In the case of Santander, this centrifuge dynamic is compounded by the pressure of second tourist homes, which exacerbates the price factor, and the aging of the built environment, with the average age of housing being 50 years, according to Catastro data. In response to this phenomenon, the City Model must provide a solution in the form of improved quality of life, regeneration, and affordable housing supply, which retains population and allows for the creation of stable communities with sufficient critical mass to make a proximity city possible, a City of Citizens (Ministry of Development, 1997).
The summer tourist pressure and significant industrial activity create substantial strains on the river and marine resources of the Bay of Santander. These impacts are common to all surrounding municipalities and can only be addressed from a common metropolitan perspective. Additionally, urban and residential improvement measures necessary for population stabilization from the municipal viewpoint can be ineffective if there is no territorial balance and appropriate competition among the municipalities in the metropolitan area. In fact, one of the main territorial issues of the Santander metropolitan area arises from the uncontrolled suburban sprawl of the neighboring and coastal municipalities, a sprawl with significant environmental consequences, uncertain remedies, and vulnerability to future energy crises.
Therefore, the Model promotes the establishment of a supramunicipal entity or plan to coordinate territorial policies for growth planning, population distribution, and activity. Its objective would be to foster the development of all municipalities in the metropolitan ring, not compromise common natural resources, coordinate housing policies to ensure that the population can settle in their municipality, and promote a compact, continuous, and mixed occupation of the territory to minimize its environmental impact due to private transportation, land occupation, and the inefficiency of existing or planned infrastructures.
Analysis: The Proximity and Regenerative City

Global Indicators Diagram
The study of the six thematic dimensions that shape the vital and inclusive city is carried out through a system of indicators applied to all delineated neighborhoods. This analysis is based on data obtained from public sources and fieldwork, complemented by descriptive and qualitative information. The methodology proposes a tool to facilitate the implementation of the model: a six-pointed star with global indicators for each neighborhood, allowing a synthetic visualization of the current state of each in comparison with the others. The global indicators are comparative indices for each of the six dimensions, calculated from the quartile categorization of the most relevant indicators in each theme.
The tool’s objective is to serve both decision-making and the dynamization of participation, as well as to facilitate the evaluation of the evolution and progression of neighborhoods throughout the model’s implementation.
1 – Access to Housing
The adequacy of the residential park allows for identifying inequalities between neighborhoods, as well as anticipating potential problems arising from social transformations for which the park is not prepared. The diagnosis recognizes issues such as the increase in vacant housing, the limited typological adaptation to the growing diversity of households, the potential relationship between rising housing prices and tourist rentals, and the poor conservation and accessibility of the built environment. The overall indicator shows how the expansion and peri-urban neighborhoods, S-20 La Torre and Valdenoja, enjoy the best relative housing values, with newer buildings, high occupancy, and an appropriate ratio between inhabitants and housing area. Meanwhile, various problems studied accumulate in the urban core. The Los Ríos neighborhood exemplifies a significant contrast between the obsolescence of the residential fabric and the average housing sale price, which is well above the municipal and national average.

3 – Accessible, Safe, Naturalized, and Equipped Public Space
Proximate public space is recognized as the main connector of public life, making its optimal provision and design indispensable. Santander features a wide variety of urban fabrics, ranging from the densest areas like San Fernando to the more dispersed ones like San Román de La Llanilla, which affects the availability of open spaces per inhabitant, creating initial inequality. However, there are common issues present to varying degrees in each area, related to accessibility, safety, and the level of naturalization of streets, parks, and plazas. The overall indicator shows that the neighborhoods with the worst conditions are located in the urban core, not only due to having less open space per inhabitant but also, and mainly, due to poor accessibility, a high number of unsafe points, and low street naturalization. In contrast, the neighborhoods with the best conditions are El Alisal, Cazoña, El Sardinero, and Nueva Montaña, which are more accessible and green, with fewer unsafe spaces detected.

4 – Cultural Activation and Citizen Participation
This theme has the most cross-cutting nature, as it focuses on the capacity for social mobilization and cultural creation. To assess the state of the neighborhoods, existing and potential heritage resources are analyzed, along with the level of use and enhancement of each, as well as the range of cultural resources available in the municipality, from cultural facilities to art galleries. This is contrasted with social activity, the number of existing associations, and the various active cultural activities. The indicators reveal the differences between neighborhoods, showing that the southwestern neighborhoods, El Sardinero, and Valdenoja, have poorer conditions in terms of participation, culture, and heritage. In contrast, neighborhoods with a stronger identity, such as Cueto, Castilla-Hermida, and Pesquero, boast a more dynamic associative network and greater cultural provisions that enhance creative and community activity. The city center stands out for its numerous heritage assets.

5 – Social Rights: Equality, Inclusion, and Health
These factors are made visible through the socioeconomic structure, based on inequalities and the efficiency of the public service network. Among the indicators are the aging index, the risk of mortality, the distribution of the lowest incomes and the migrant population, and the provision and coverage of public facilities. Overall, we see how the neighborhoods with the best conditions are located in the east, while the most vulnerable ones are situated in the center and southwest: Alta-Cabildo, Campogiro Cajo, Camarreal, and Castilla-Hermida-Pesquero. The latter has the highest rate of migrant population, high mortality risk, and personal income below the average, while Calle Alta-Cabildo suffers from greater aging. This group also includes the neighborhoods adjacent to Calle Fernando de los Ríos, which experience high aging rates, as well as a lack of public services, with incomes below the average, and Entrehuertas-Prado-San Roque, with a similar situation but less aging.

6 – Promotion of Productive and Educational Opportunities
The promotion of opportunities is defined by the diversity of activities within an urban fabric, essential in a city of proximity. Neighborhoods require productive land that offers employment and energizes urban life, as well as an educated population capable of developing these activities. The overall indicator shows the relationship between socioeconomic factors — the level of education and household income — and the balance between productive and residential activity. As a result, we obtain a picture where productive and educational opportunities are weaker in the neighborhoods of La Albericia, Calle Alta, Entrehuertas-Prado-San Roque, and the two neighborhoods adjacent to Calle Fernando de Los Ríos. These are neighborhoods where the balance between activity and residence is far from optimal, either by excess or deficiency, where the social fabric has a basic educational level and low-paying jobs. Conversely, the most dynamic neighborhoods with greater opportunities are Puertochico, Estaciones-Catedral, San Fernando, and Cuatro Caminos.

7 – Ecology, Climate Change Adaptation, and Circular Management
The level of environmental adequacy in the city has a direct impact on local surroundings. Therefore, recognizing the main differences between neighborhoods regarding environmental issues, as well as existing initiatives for improving energy, water, and waste management, allows us to propose a simplified and comparative approach to the ecological reality of the neighborhoods, which is further developed in Strategy 4: Sustainable and Resilient. To establish this comparison, we work with the most relevant available data: soil permeability, noise levels, air quality, waste management systems, and the energy efficiency status of buildings. The overall indicator shows that the greatest deficiencies are located in the south-central part of the city, in the neighborhoods of Castilla-Hermida-Pesquero, Estaciones, and Calle Alta, due to limited permeable land, high traffic, low provision of recycling points, and an insufficient percentage of energy certifications.

Proposals
1 – Proximity Network
The proximity network is defined as the regenerated provision network, the collection of open spaces and public facilities that shape the neighborhoods of the city. In the built city, this network faces common issues: obsolete public spaces with limited pedestrian and commercial readability and insufficient public facilities that are poorly adapted to new social needs, limiting the desired vitality in various urban fabrics. Prioritizing the convivial street network, reinforcing central areas that boost urban life, and adjusting the parameters of public services are priority challenges to ensure a vital and inclusive city that supports the daily activities of its diverse inhabitants.
From an urban planning perspective, attention to provision land has exclusively focused on new developments, for which urban legislation establishes land reserve determinations for roads, green areas, and facilities. However, the future City Model requires a different approach. It is necessary to review the provision structure of the existing city, considering not only its built surface but also its connectivity, program, and management, to configure functional units in each neighborhood that facilitate coexistence and the transition towards more sustainable lifestyles.

2 – Regeneration Areas
Regenerative areas reconfigure the existing city and adapt the residential fabric to meet the standards of a proximity city. To achieve this, two strategies are deployed: urban regeneration and renewal areas, aimed at rehabilitating vulnerable areas of the city, and consolidation and growth areas, aimed at integrating urban growth as a component of proximity. These include both infill operations on unconsolidated or repurposed industrial or port lands and edge growth, which supports the functionality of peri-urban neighborhoods.
Urban inequality and vulnerability are among the main challenges cities face today, partly due to the neglect of the existing city during the 21st century, which also exacerbated spatial segregation dynamics, as various studies have shown. Notably, in the national context, is the Urban Vulnerability Atlas (MITMA, 2022).
Santander has a wide array of housing groups and colonies built between the 1950s and 1970s. These neighborhoods, typically characterized by open blocks, low construction quality, and open spaces used as parking lots, have seen little renovation. This “intermediate periphery,” midway between major central operations and the new peripheries of the 1990s, mostly requires regeneration actions and thus serves as a starting point for identifying urban regeneration and renewal areas.
The City Model proposes advancing the system for identifying urban regeneration areas so that the PGS includes planning figures suited to their needs. This identification is based on building, sociodemographic, and environmental variables of the urban environment.
Thus, the Santander City Model, Future Habitat, recognizes 44 urban regeneration areas, among which 10 priority regeneration areas are identified, in addition to those already declared by the city, totaling 14. The remaining areas are medium-priority urban regeneration areas, alongside zones recognized for their social priority.

3 – Global Indicatros

————————————————————————————————————————————————————————————————————————————–
Strategy 2: Santander, structured and connected
Santander, structured and connected, plans and facilitates the necessary infrastructure and systems to reconnect the city, promote modal diversity, and progressively and completely decarbonize mobility. Through comprehensive city modeling, a system is proposed that reduces through traffic and provides competitive, low-environmental-impact alternatives that support the transition to carbon neutrality. This strategy aims to shorten travel distances and encourage more ecological modes of travel—on foot, by personal light vehicle, or electric collective transport. The model implements multiple actions: it distributes centralities and proximity-based productive activities; establishes an accessible pedestrian and cycling network to enhance walkability; redesigns a much more efficient and competitive public transport layout connected to modal exchange points; strengthens the role of the bay and maritime transport; and accelerates the electrification of mobility through a new fleet of personal electric vehicles linked to parking facilities that free up public space, thereby shaping the transition to future mobility.

Strategie 2 Scheme
Understanding the Mobility Bioregion
The metropolitan area of Santander includes the municipalities that have a connection with the bay and with the city itself. Therefore, to characterize, analyze, and act on the mobility system of the municipality, it is necessary to include an analysis of its relationships with its closest surroundings.

Regional mobility network
The intermunicipal mobility of the bus network connects the capital with its nearest surroundings, generally using urban buses. Currently, the services are grouped into six main lines with different routes that cover the population centers of the neighboring municipalities and connect the city stations with the airport, located in Camargo. All lines terminate at the Santander Bus Station, and most access it through the central axis, via Cuatro Caminos-San Fernando-Jesús de Monasterio, having to enter the stations through the Botín Center tunnel due to the deterrent effect caused by the narrow road section of the Pasaje de Peña.
The line with the highest demand, by far, is the Santander-Maliaño-Astillero, with over 1.5 million passengers per year, surpassed only by lines 1 and 2 of TUS (Urban Transport of Santander). The second line is the Santander-Liencres-Mortera, which covers the entire northern access to the city, with over 540,000 passengers annually, a demand similar to lines 6c1 or 6c2 of TUS. The data shows that Santander’s local bus service has maintained the number of passengers in recent years, transporting around 2.5 million annually.

Ischrones of private transport in the metropolitan area
The city has local train services operated by Renfe, both on Iberian gauge tracks (Renfe, Santander-Reinosa Line) and metric gauge tracks (Feve, Santander-Cabezón and Santander-Liérganes). The Feve local service offers extensive daily service, with average intervals of 15-30 minutes depending on the area and very competitive travel times. In contrast, the Renfe line has poorer intervals, partly limited by infrastructure issues such as single-track sections, resulting in higher frequencies from Renedo station, with 24-minute intervals in the early morning and variable intervals of up to an hour for the rest of the day.
The maritime passenger transport service, although linked to tourism, connects the southern bay towns with Santander through a regular line. Its impact on the city, along with regular line ferries and cruises, is minimal, being primarily a matter of entry and exit traffic at the port. In the realm of goods transport, the port plays a fundamental role in Cantabria’s industrial and commercial fabric, generating significant transport activity, although this does not affect internal mobility. The main demand is the improvement of access routes, especially rail, as it is one of the Spanish ports with the highest percentage of rail use.
Regarding the airport, territorial planning includes proposals such as increasing flight frequencies to Madrid or attracting new operators to minimize dependency risks on certain companies. The city is connected to the airport (located in Camargo) by bus lines, and there is also a taxi service.
Analysis: The Proximity and Mixed City
In order to validate and evaluate the economic, social, and environmental cost of a mobility measure, it is necessary to quantify its impacts as precisely as possible. Therefore, a mobility simulation and prediction model has been developed for the city of Santander. The following outlines the approach adopted for the development of this model and its scope in evaluating future scenarios.

Diagram of the organization of the analysis model
The model is organized into four stages. The first stage, “trip generation,” is based on linear regression techniques, simulating the production and attraction of trips in each area using information from households and land uses. The second stage, “trip distribution,” uses the data from the previous step and the travel distance histogram to obtain the total trip matrix for the study area. The third stage, “modal choice,” is a discrete choice model between public transport, private motorized transport, and other modes, using revealed preference data such as travel time, cost, wait time, or transfer time. Finally, the “trip assignment” or propagation of trips on the network is performed, which in the case of public transport, can be frequency-based traffic assignment. Additionally, the assignment of pedestrians and bicycles is carried out.
Complementarily, a submodel has been developed to determine the optimal number and location of park-and-ride facilities and intermodal nodes, based on the design of transport services, traffic restrictions, and new road infrastructures. This model is based on a sequential and iterative process, where the user selects transportation alternatives based on their travel destination. In this way, the user tends to choose the transportation alternative that maximizes their utility (or minimizes their generalized travel cost) to reach their destination.
 Travel demand by neighborhood (2022)
Currently, there is an imbalance in the production of trips towards the center and south-southwest of the city, where more trips are generated compared to neighborhoods in the north and northwest. Applying the future trip generation models, the variations are, however, more significant in the north of the city, with increases of 30-40% in the northern and northwestern neighborhoods, 50% in the central-west, and up to 80% in the central-east (Los Castros), although from a medium/low baseline. These data, along with the development of PCTCAN, highlight the need to improve communications and sustainable transportation in these areas to prevent the increased demand from relying on private vehicles for trips to the center.

The large incoming and outgoing traffic of motorized vehicles, both via Avda. de Parayas and the S-20, is mainly distributed within the city through the Castilla-Hermida and Avda. de la Constitución axes. However, a road with high average daily traffic (ADT) does not necessarily imply congestion problems, so it is important to identify roads with saturation. In addition to the mentioned Avda. de Parayas and the S-20, notable roads include Castilla Street, the Tetuán tunnel, and specific points on General Dávila and in the city center. The CA-231 access is also noteworthy, as it shows significant saturation despite not having higher traffic.
On the other hand, some roads have experienced a clear improvement; streets like Vía Cornelia and Camilo Alonso Vega have improved thanks to the recent La Marga Distributor, which channels part of the transverse flow of incoming and outgoing traffic in the city. In this regard, roads with traffic below their capacity can be utilized to optimize or expand the use of public and pedestrian space.
A high level of traffic is observed in public transportation on the corridor from Valdecilla to Puerto Chico, with values close to 10,000 passengers per day. According to the PMS, more than 55% of trips are concentrated on 6 out of the 22 existing lines, while in 14 of them, the number of passengers does not exceed 3% of the total demand. Some lines also show increases of over 40% during the summer period.
By aggregating the average demands at stops during the summer and winter months, a clear picture of demand polarization in the city can be obtained. The central axis of the city, from Valdecilla to Puertochico and the Sardinero area, depending on the time of year, supports the highest number of passengers. The potential demand for the Cavzoña-Alisal, Castilla-Hermida, and General Dávila corridors can also be observed, as well as other specific points such as El Corte Inglés, Universities, Corbán, or shopping centers. Most of these areas have a distribution with two peak hours throughout the day.
Bicycle traffic primarily flows through the existing bike lane network, reaching sections with 300 cyclists per day, representing a modal share of 1%, which could be significantly higher. Although there is a Santander Cycling Mobility Plan (2016) that includes detailed and ambitious plans to expand the network, it is not harmonized with the public bicycle system, which has not evolved in recent years and has a very low coverage rate of 30%.
On the other hand, proper planning based on universal accessibility criteria is necessary to avoid disadvantages for certain groups. Specifically, in the appropriate definition of lanes for bicycles and scooters on semi-pedestrian streets or Shared Space Platforms, ensuring a safe transit zone for pedestrians with elements perceptible to visually impaired people. In this regard, the mentioned Santander Cycling Mobility Plan identifies several black spots and commits to adopting a process of continuous improvement, extension, and review of cycling infrastructures.

Regarding the pedestrian network, the main flows are concentrated in the city center and the transversal pedestrian mobility axes that include funiculars, elevators, ramps, or escalators. Undoubtedly, this demonstrates that investment in this type of infrastructure encourages walking. Evidence of this can be seen in the Sustainable Mobility Plans (PMS) of 2010 and their current revision in 2022, as well as the Pedestrianization Study of 2012, which promoted various initiatives in this field.
The attached map shows the accessibility coverage ratio, indicating areas within 500 meters of elevators, ramps, and escalators, reaching almost 50% of the population. The critical points are the remaining areas not connected by these necessary infrastructures in a hilly municipality like Santander.
Proposals

From multimodal simulation and potential demand estimation in proposed future scenarios, actions are proposed on two levels: a first set of structuring measures and another with complementary proposals, all aimed at achieving a city based on sustainable modes, less dependent on cars, and integrated with the new mobility patterns derived from the new model and its socio-economic activities.
This action is based on the concept of LEZ (Low Emission Zone) that Santander must implement in the short term, according to Law 7/2021, of May 20, on climate and energy transition. It states that municipalities with more than 50,000 inhabitants and island territories must adopt sustainable urban mobility plans before 2023 that introduce mitigation measures to reduce emissions from mobility, including the establishment of low emission zones.
Although nothing concrete has been defined for the city of Santander yet, any future scenario will include a zone with restrictions on polluting vehicles. Therefore, it is necessary to hypothesize the existence of a restricted traffic zone, which in this document we will call VRZ (Vehicle Restriction Zone), because, in addition to environmental and air quality reasons, there is an issue with the space occupied by vehicles and congestion in urban centers. The LEZ is defined as a specific continuous area delimited by a municipality, where access, circulation, and parking restrictions are applied to vehicles to improve air quality and mitigate greenhouse gas emissions.
Inspired by this definition, a VRZ is proposed in the area between the streets of General Dávila, Menéndez Pelayo, Casimiro Sáinz, Paseo Pereda, Estaciones, Marqués de la Hermida, La Marga, and Camilo Alonso Vega. This zone is extended westward to Manuel Llano, covering Ciudad Jardín and the Valdecilla Hospital, defined by Torres Quevedo and Sáinz de la Maza streets. Simultaneously, another VRZ is defined on the Las Llamas university campus, following the Sustainable Campus policy to be implemented, joining the northern slope of General Dávila to avoid a foreseeable border effect.
This first proposal fits the existing road network but will have future changes that must be considered. Probably the most impactful will be the liberation of the large area occupied by the railway and its impact on the Castilla-Hermida neighborhood. This will allow the reordering of Castilla and Marqués de la Hermida streets, shifting from channels for incoming and outgoing city traffic to local streets. Therefore, it is reasonable to consider that this neighborhood will also be part of the VRZ.

Considering the types of vehicles with restricted access to the VRZ and the vehicle fleet typology, the impact of this measure can be estimated using a demand model. A direct impact is assumed on at least 20% of vehicles, which will have to choose either to continue their journey in motorized mode but change their destination or switch to a transport mode that allows them to reach within the VRZ. Under these assumptions, the VRZ will affect almost 60,000 trips per day, which will need to be offered transport alternatives to channel the mobility that will be restricted.
With the traffic restriction in place, it is proposed to create a network of intermodal nodes connected with alternative transport modes, allowing private vehicle trips to end and park in these nodes, to reduce the high level of incoming traffic in the city and enable people to access the city center by public transport, public bicycle, scooter, or on foot.
These nodes are based on free, video-monitored park-and-ride facilities, with complementary services and facilities to encourage modal shift, such as public bus stops, bike rental points, and electric vehicle charging points. They can be combined with various management formulas, such as reserving a parking spot with the purchase of a bus ticket through a mobile application.
The location of these points is established at intersection nodes near the main high-capacity roads and railway stations, close to the VRZ boundary, and connected with public transport and bike lanes on the main longitudinal and transverse access routes to the VRZ.